
Last issue we covered the Sharpe ratio — excess return divided by volatility, showing how much you earned per unit of risk taken. But the Sharpe ratio had one odd feature: it counts large gains as "risk" too, and shaves the score down.
To an investor, a big jump to the upside is welcome, not something to fear. The indicator that fixes this awkwardness is the Sortino ratio. Today we lay out what it looks at differently.
What the Sortino Is — in One Sentence
The Sortino ratio is almost the same as the Sharpe ratio, except it uses only "downside volatility" in the denominator. It's named after Frank Sortino.
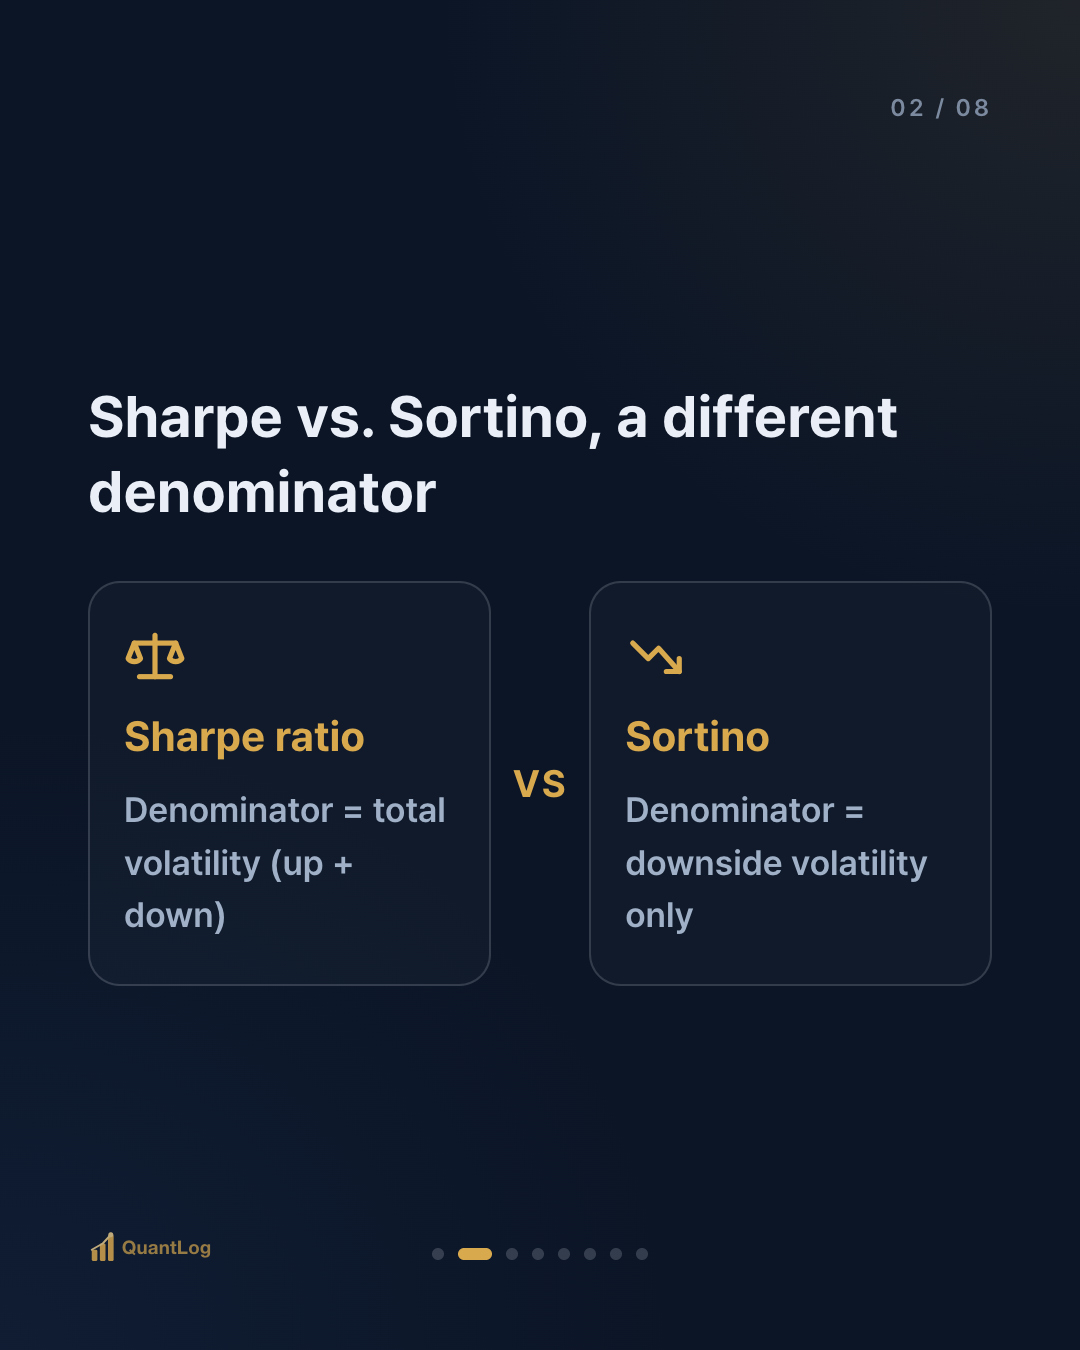
- Sharpe denominator = total volatility (upward swings + downward swings)
- Sortino denominator = downside volatility only (downward swings only)
So the Sortino doesn't count "good volatility" (gains) as risk, and counts only "bad volatility" (losses) as risk. The numerator is excess return, just like the Sharpe. That's why a strategy that jumps hard to the upside scores higher on the Sortino than on the Sharpe.
Why Look at the Downside Alone
The crux lies in what an investor actually fears.
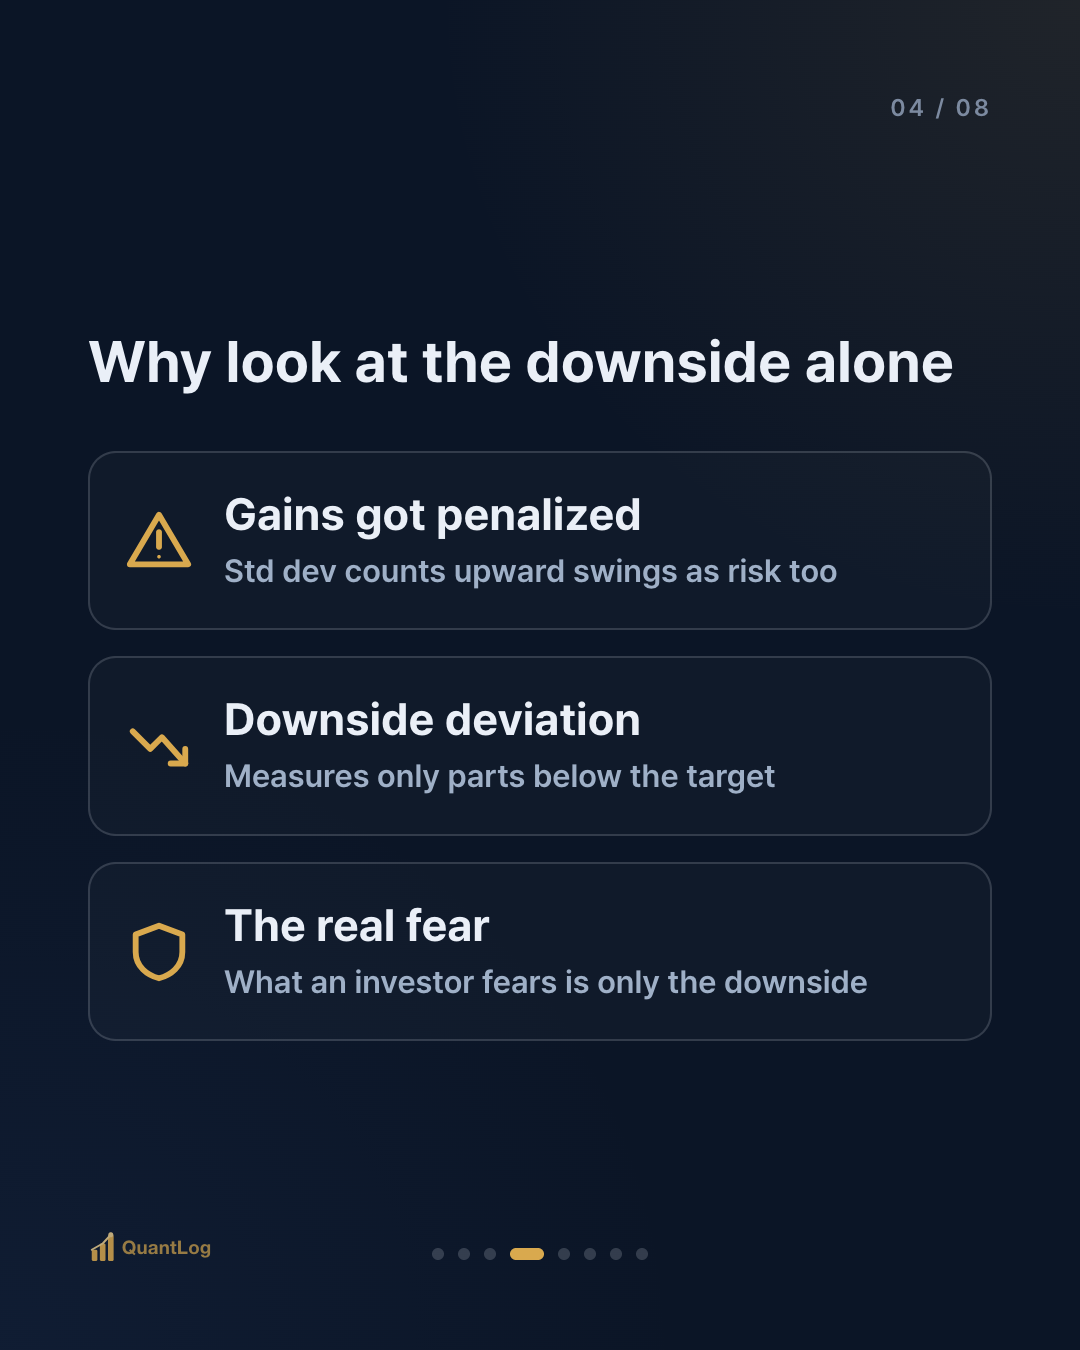
Say returns swung to +15% one month and +3% another. These swings are all to the upside. There was never a loss. Yet the standard deviation counts even these upward swings as "volatility" and shaves the Sharpe down. In effect, you get penalized for earning well.
The Sortino corrects this point. A loss is risk, but a large gain is not. So it selects only the parts that fell below a target return (usually 0 or the risk-free rate) and measures that variation. This is called the downside deviation.
In a word, the Sortino asks not "how much did it swing" but "how badly did it swing."
Sharpe vs. Sortino, When Do They Diverge?
When do the two indicators differ greatly?
They diverge when the return distribution is skewed to one side. For a strategy whose gains are gentle and large while its losses are rare but sharp, the Sortino comes out more generous than the Sharpe, because the upside variation is removed from the denominator.
Conversely, for a strategy whose ups and downs are symmetric, the two indicators come out similar. If upward and downward variation are about equal, isolating the downside doesn't differ much from total volatility.
So looking at both together reads a strategy's character. When the Sortino is noticeably higher than the Sharpe, that strategy's volatility came mainly from the upside. The reverse signals that the downside swings were large.
The Limits of the Sortino
The Sortino isn't perfect either.
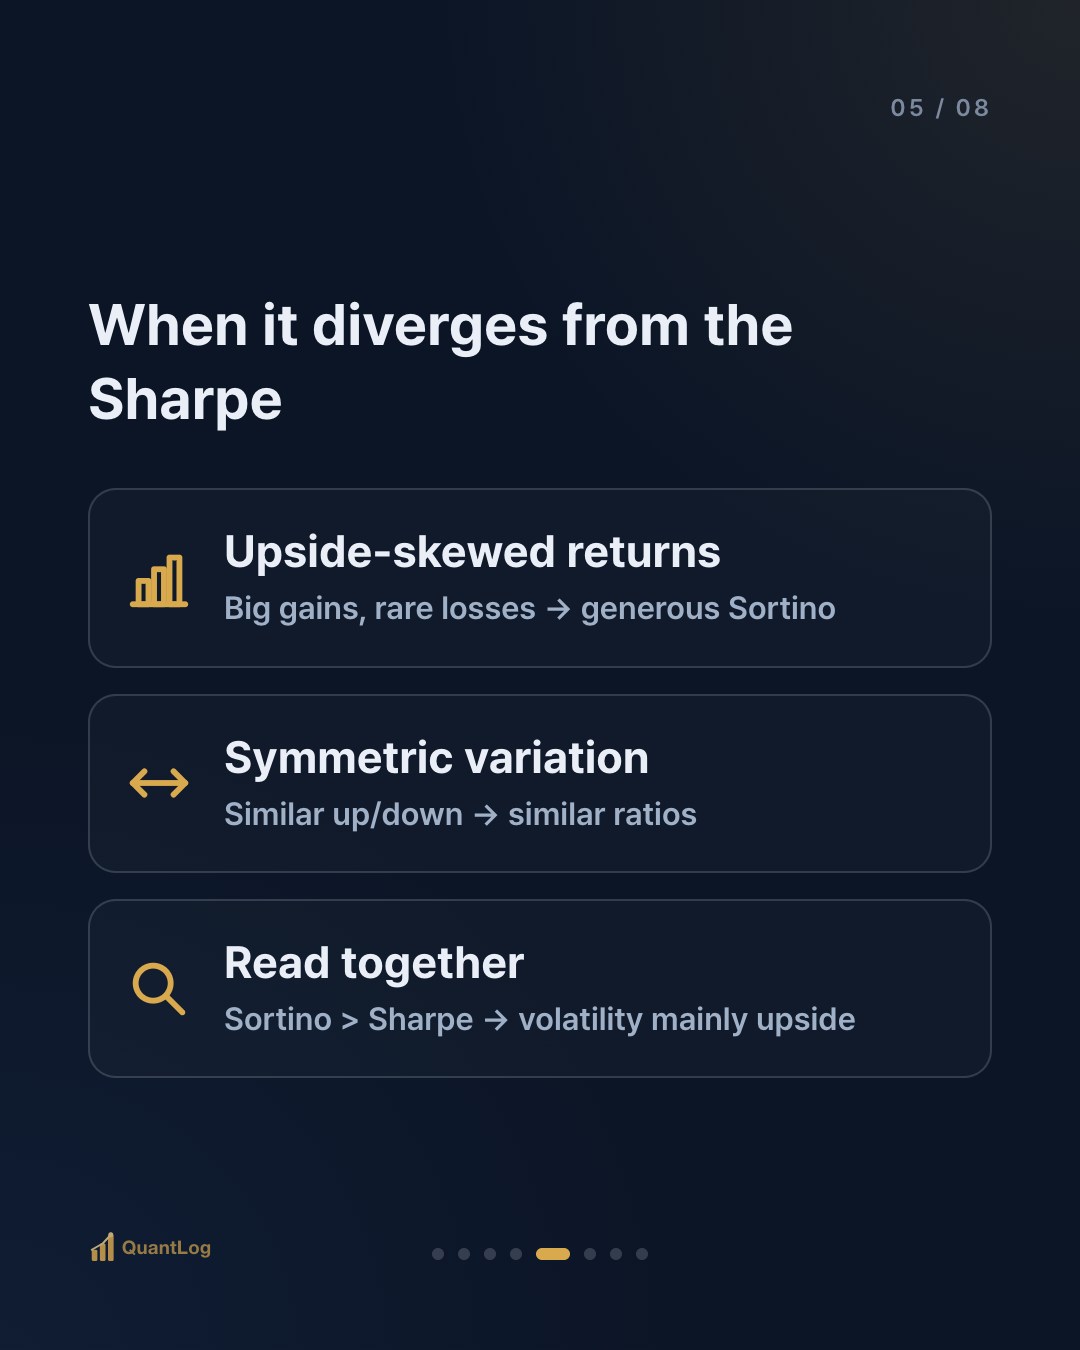
① It's still the past. Like the Sharpe, it's computed from past data. A high Sortino doesn't guarantee the future.
② It's unstable when downside data is scarce. The rarer the loss periods, the smaller the sample for computing downside deviation, and the more the value jumps around. A strategy that hasn't yet been through a big drawdown can show an unrealistically high Sortino.
③ Its value changes with the target return. Whether you set the baseline at 0 or the risk-free rate changes what counts as downside, so the value shifts. You shouldn't compare Sortino ratios computed on different baselines at face value.
To Sum Up
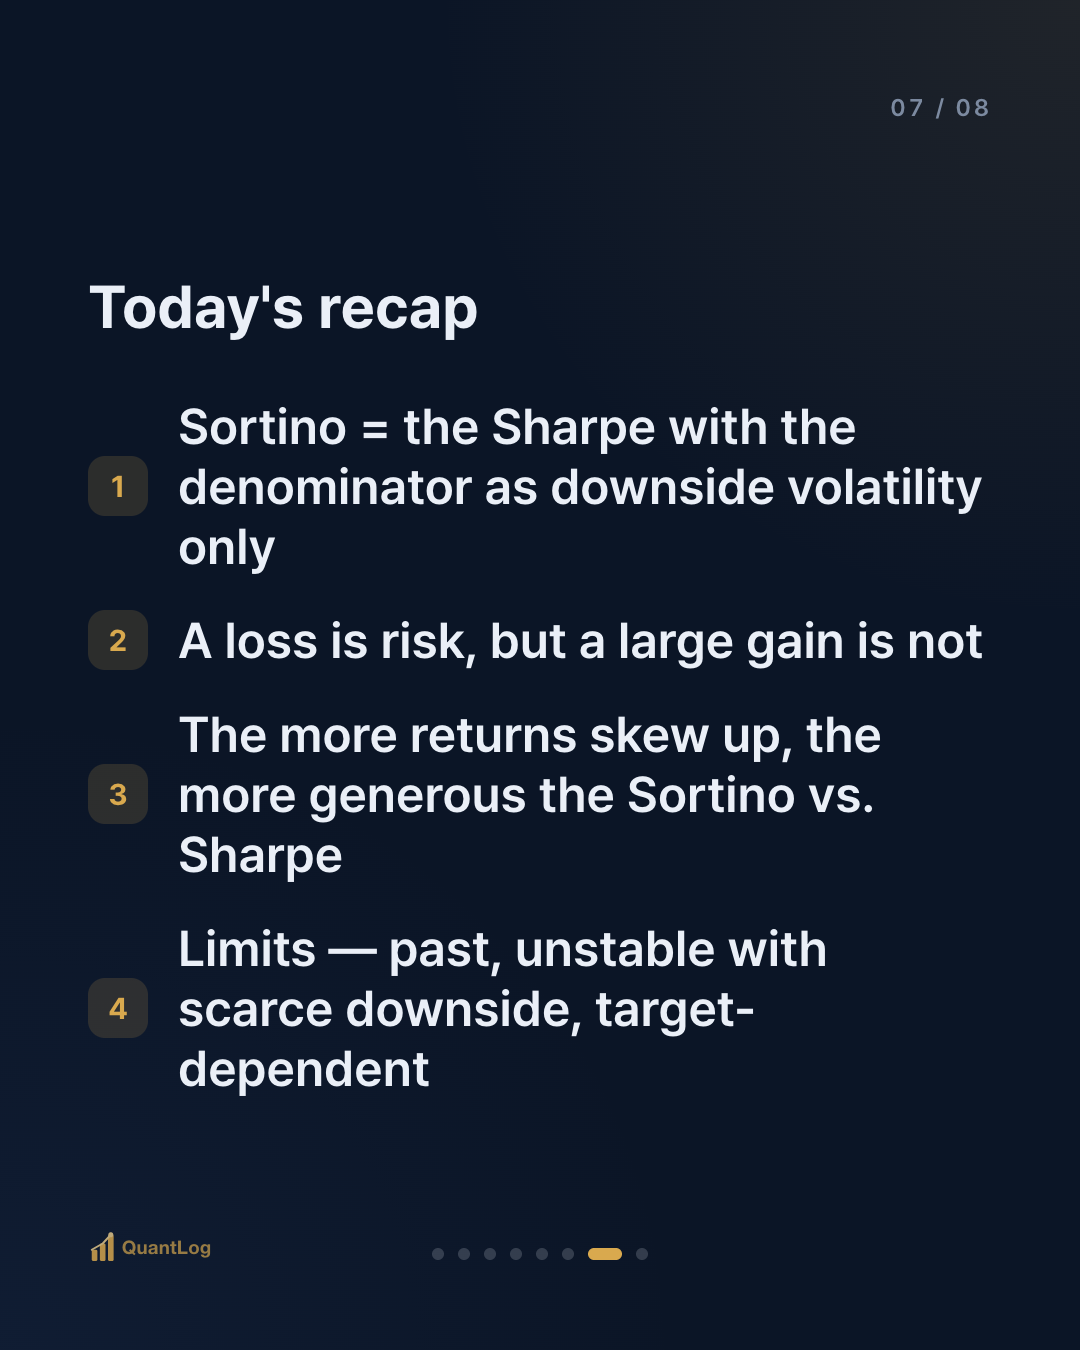
- Sortino = the Sharpe ratio with the denominator switched to downside volatility only. The numerator is still excess return
- Reason: a loss is risk, but a large gain is not. It doesn't punish jumping to the upside
- Where it diverges from the Sharpe: the more the return distribution skews up, the more generous the Sortino
- Limits: it's only the past, unstable with scarce downside samples, and depends on the target return
If the Sharpe ratio asked "how much did it swing," the Sortino asks "how painfully did it swing." Put the two side by side and you can see whether a performance's volatility came mainly from joy or from pain.
References
- Sortino & Price, "Performance Measurement in a Downside Risk Framework," *Journal of Investing* (1994) — the formalization of the Sortino ratio
- Sortino & van der Meer, "Downside Risk," *Journal of Portfolio Management* (1991) — the concept of downside risk
- It's quickest understood read against the Sharpe ratio (0013)

Disclaimer
This article is for informational purposes only and is not investment advice. It is not a recommendation to buy or sell any security. All investment decisions are your own responsibility.

Comments 0
Be the first to comment.