
The Sharpe ratio looked at how much it swung; the Sortino at how badly it swung. But both are stories about "average variation." What actually makes an investor pull their hands off the account isn't the average — it's the single most painful moment.
The indicator that measures that one moment is MDD, maximum drawdown. Today, as the last of our three-part risk series, we lay out why this number should catch your eye before any return figure.
What MDD Is — in One Sentence
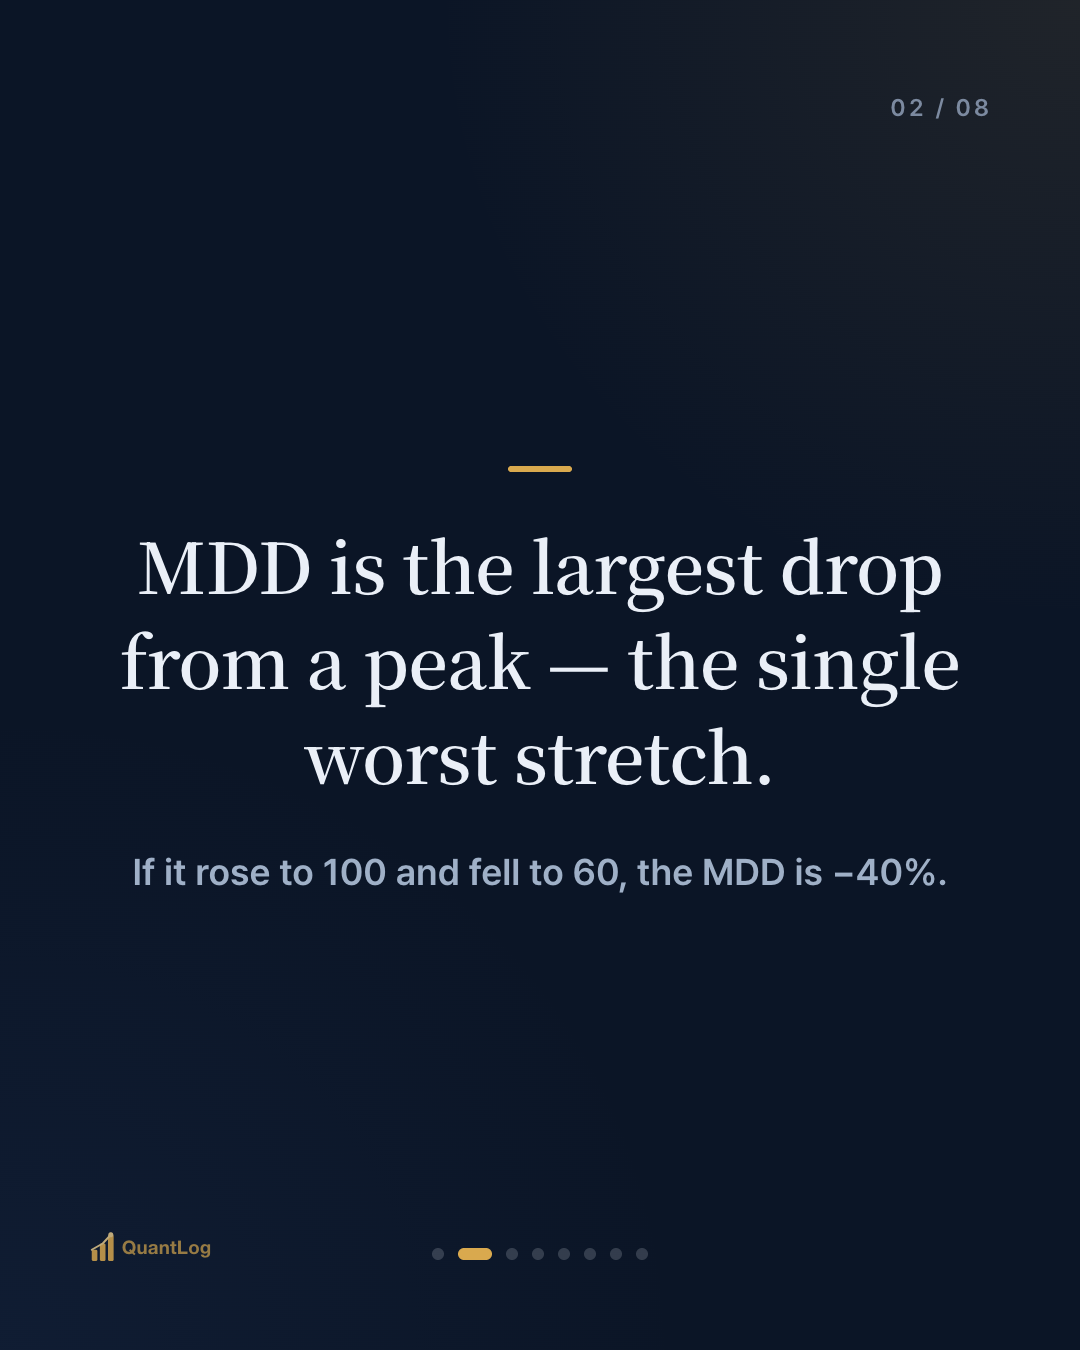
MDD (Maximum Drawdown) is "the largest drop measured from a peak."
The calculation is simple. Over the investment period, you measure, as a percentage, how far the account fell from its highest point to the lowest trough that followed. For example, if assets rose to 100 and then fell to 60, the MDD is −40%. Even if it recovers afterward, the depth of that −40% wound stays in the record.
So MDD looks not at the average but at the single worst stretch. It's the number that answers "if I'd held this strategy, how badly would it have broken at the hardest moment."
Why the Worst Matters More Than the Average
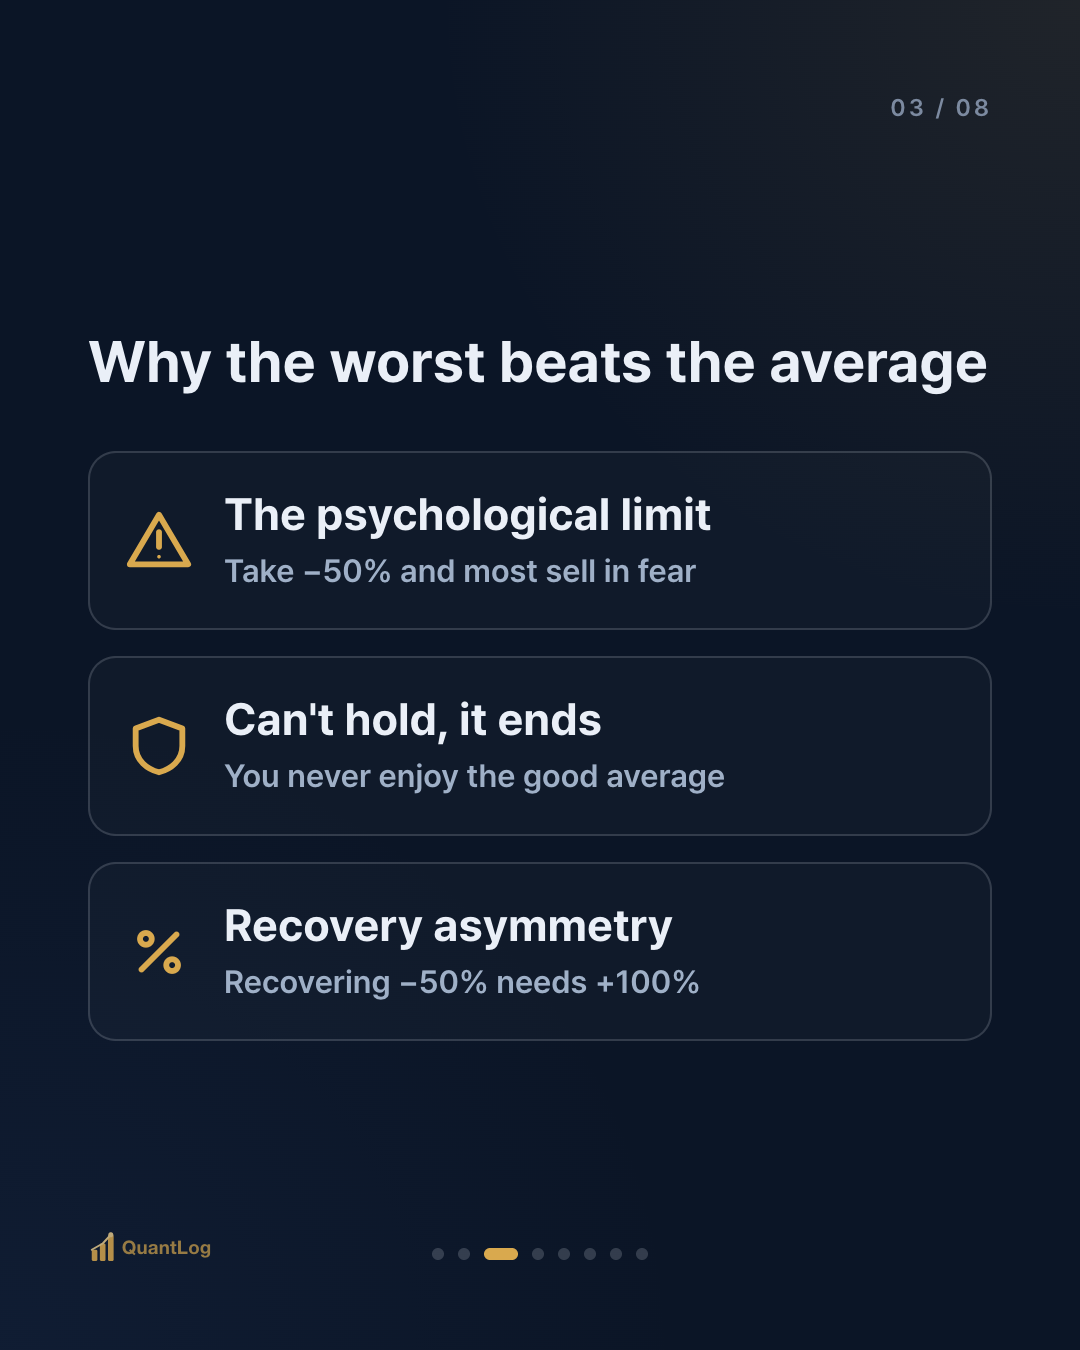
Return and volatility only mean something when you can endure them. MDD matters because if you can't hold on, you never get to enjoy that good average at all.
The psychological limit. No matter how good the annual average return, take a −50% hit partway through and most people sell in fear. At that moment, the strategy ends. MDD is a yardstick for "can I psychologically hold this strategy to the end."
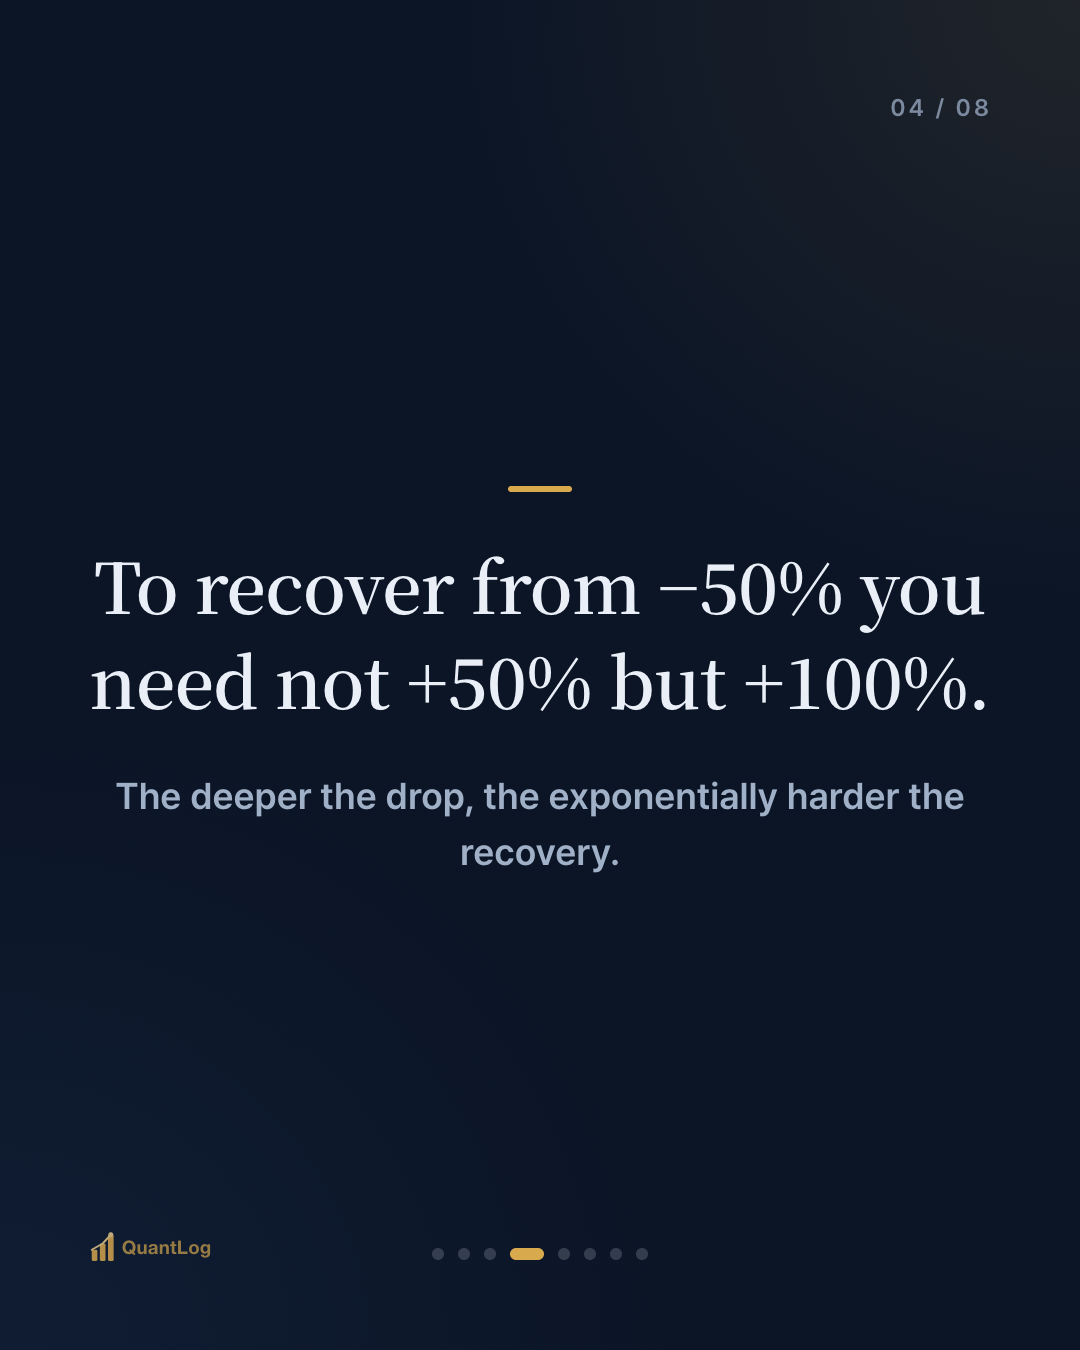
The asymmetry of recovery. Here's a cruel piece of math. To recover from −50% you need not +50% but +100%. To bring a halved asset back, you have to double it. The deeper the drop, the exponentially harder the recovery. So MDD isn't just a past record — it's also a preview of how steep a road you'll have to climb going forward.
Time to Recover — Underwater
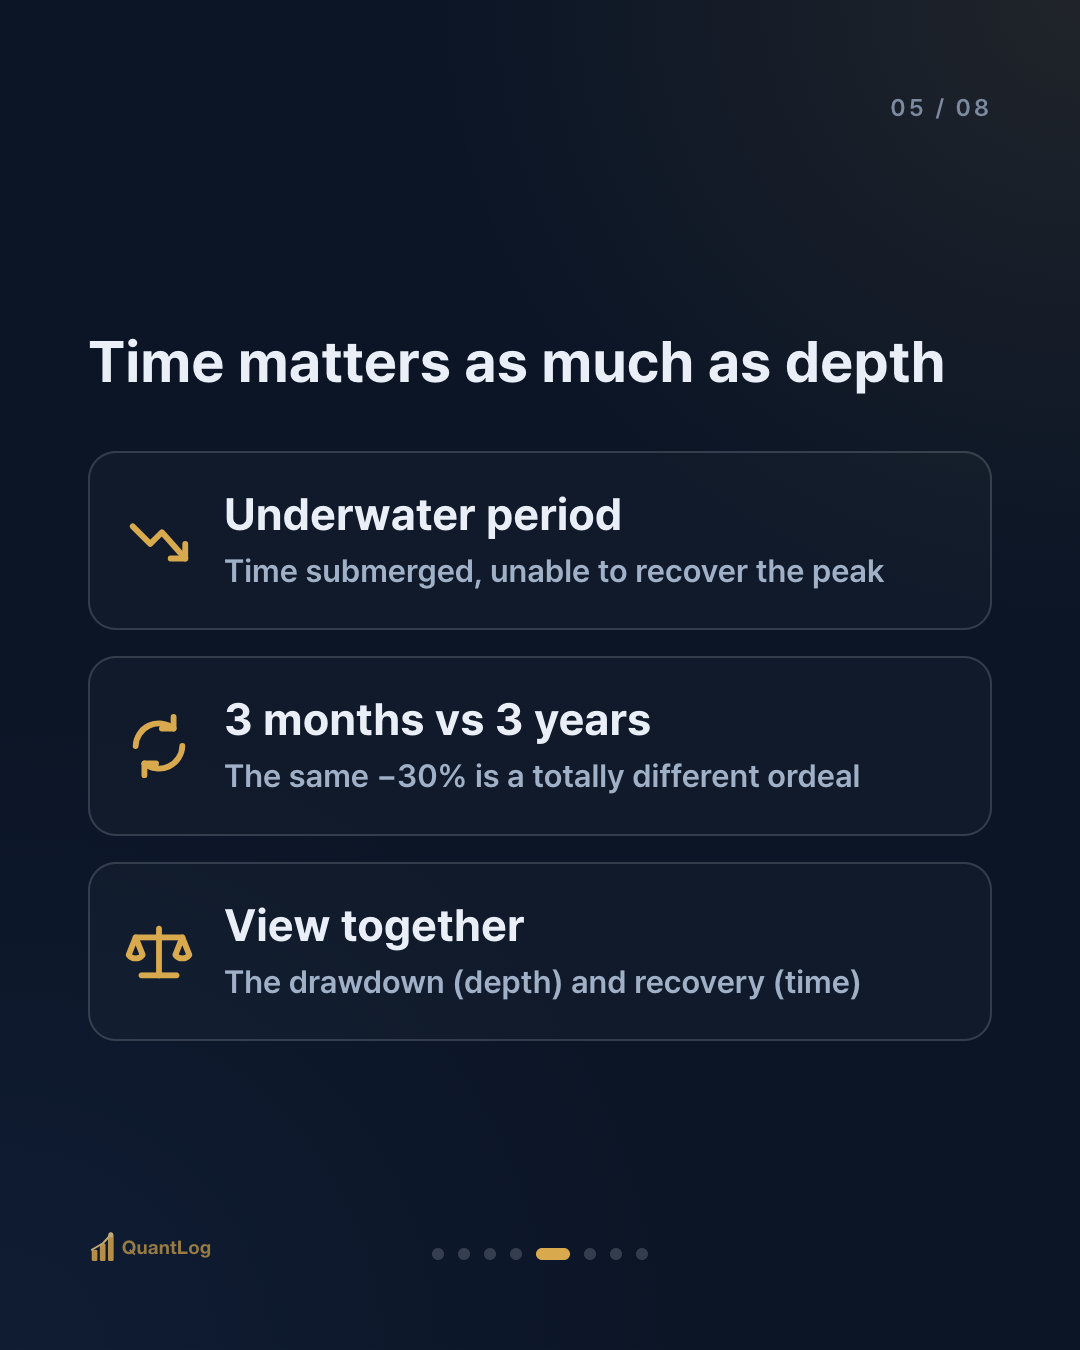
MDD tells you only "how deep it fell." But what actually wears people down isn't just depth. How long you stayed submerged beneath the peak matters too.
The period spent underwater, unable to recover the peak, is called the underwater period. Even a −30% drop is a completely different experience recovering in 3 months versus not climbing back for 3 years. The latter, though shallower, is far harder to endure.
So MDD is often viewed alongside the recovery period. How deep it was (the drawdown) and how long it lasted (the period) — you have to look at both to fully grasp a strategy's pain.
What to Watch When Reading MDD
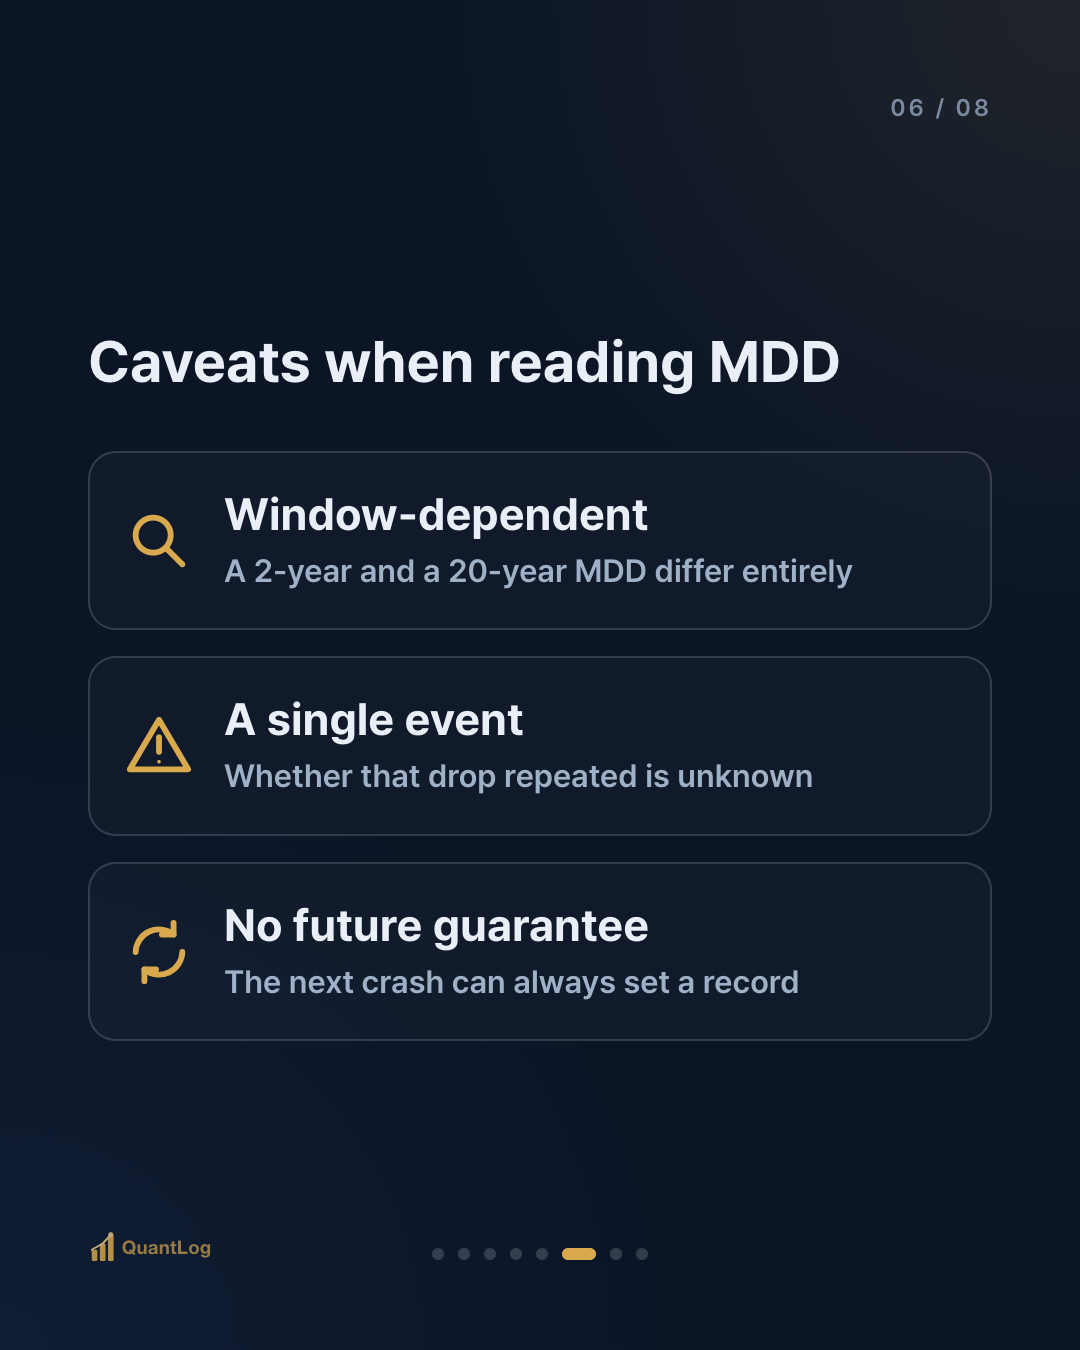
MDD shouldn't be trusted blindly either.
① It depends absolutely on the observation window. MDD is only the worst that happened within that window. An MDD from 2 years and one from 20 years are entirely different. A short-window MDD that hasn't yet seen a big crash severely understates the risk.
② It's a single event. MDD captures just one worst stretch. Whether a drop that size happened only once or repeated often can't be known from MDD alone. So you should also look at the frequency of drawdowns.
③ It doesn't guarantee the future. A past MDD of −30% doesn't mean it'll stay within −30% going forward. The next crash can always set a new record.
To Sum Up
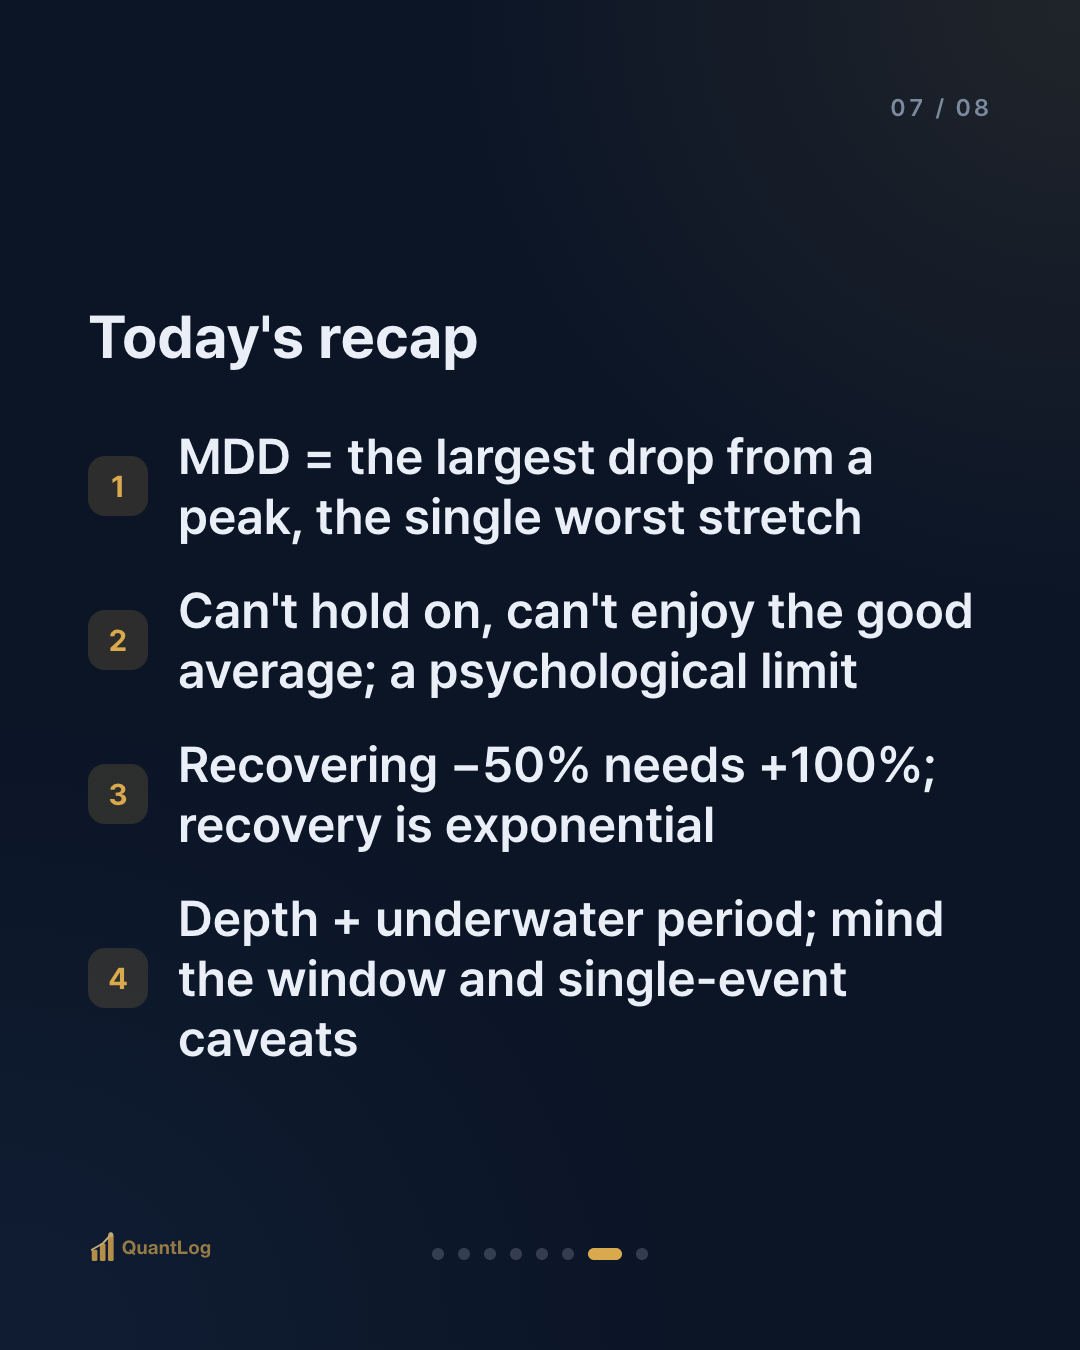
- MDD = the largest drop from a peak. It looks not at the average but at the single worst stretch
- Why it matters: if you can't hold on, you can't enjoy the good average. A psychological limit and a preview of recovery difficulty
- Recovering from −50% needs +100%. The deeper the drop, the exponentially harder the recovery
- Watch not just depth but the underwater period. Caveats: window-dependent, a single event, no guarantee of the future
If return is "how much you can earn," MDD is "how much you have to endure." And however good a strategy is, if it can't survive that worst stretch, it's as good as nonexistent. That's why seasoned investors look at MDD before return.
References
- Magdon-Ismail & Atiya, "Maximum Drawdown," *Risk Magazine* (2004) — the statistical properties of MDD
- That recovering a −x% drop requires +x/(1−x)% is an arithmetic identity
- Viewed with risk-adjusted returns (Sharpe 0013, Sortino 0015), the picture of risk is complete

Disclaimer
This article is for informational purposes only and is not investment advice. It is not a recommendation to buy or sell any security. All investment decisions are your own responsibility.

Comments 0
Be the first to comment.