
Two people. One earned 20% in a year, the other 10%. Whose investing was better? Most pick the 20%. But if the one who earned 20% saw their account cut in half and back along the way, while the one who earned 10% came through almost without a wobble, the answer can change.
Return alone can't tell you whether an investment was good or bad. Today we lay out the indicator that fills that blank: the Sharpe ratio.
What the Sharpe Ratio Is — in One Sentence
The Sharpe ratio measures "how much excess return you earned per unit of risk taken." William Sharpe proposed it in 1966, and he later received the Nobel Prize in economics for this and related work.
Conceptually, the calculation is this:
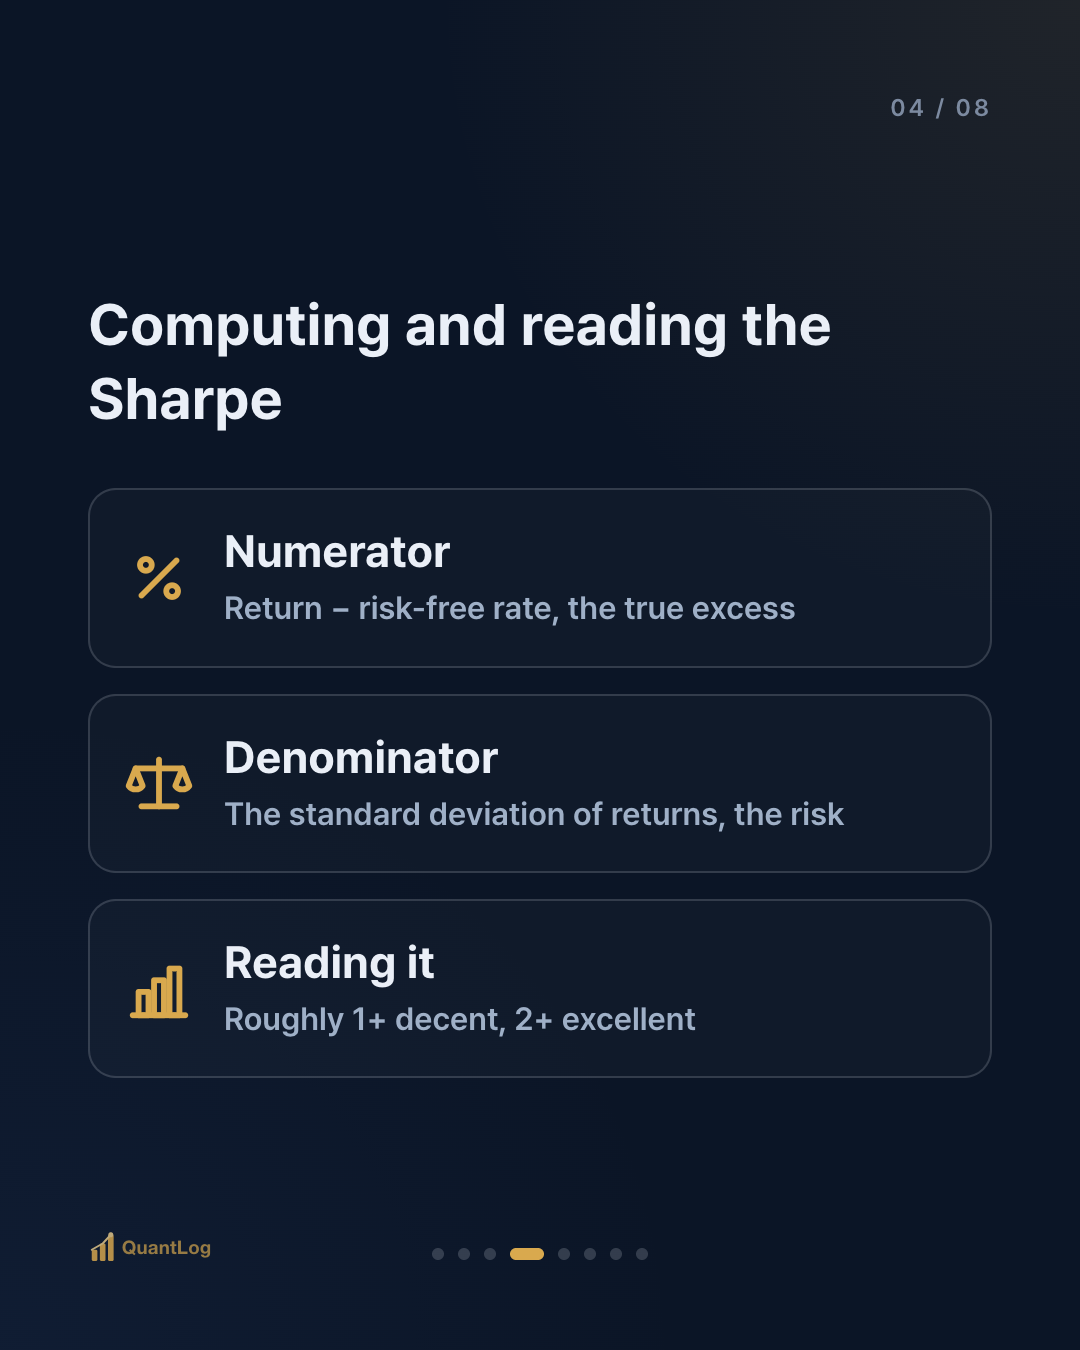
- Numerator = return − the risk-free rate (the true excess, after subtracting the interest you'd get just sitting in a bank)
- Denominator = the standard deviation of returns (how much the returns swung, that is, the risk)
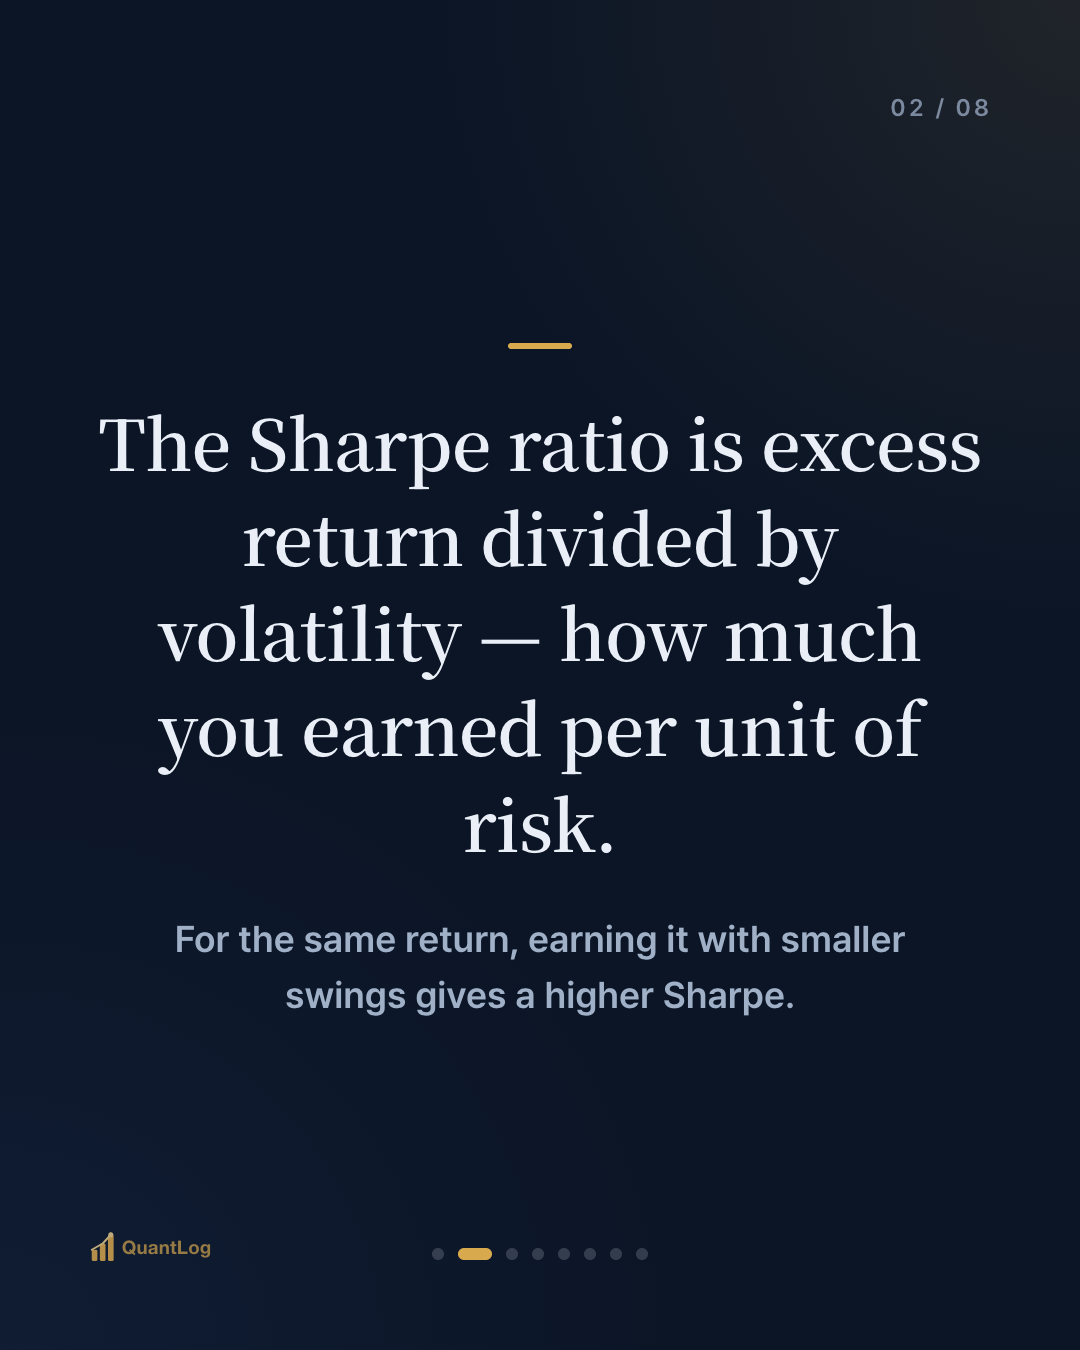
So it's excess return divided by volatility. For the same return, earning it with smaller swings gives a high Sharpe ratio; earning it on a roller coaster gives a low one.
Why Return Alone Isn't Enough
Return states only the size of the outcome, not how precarious the road to it was. The Sharpe ratio puts that precariousness in the denominator and asks "did this return come from a bearable amount of risk?"
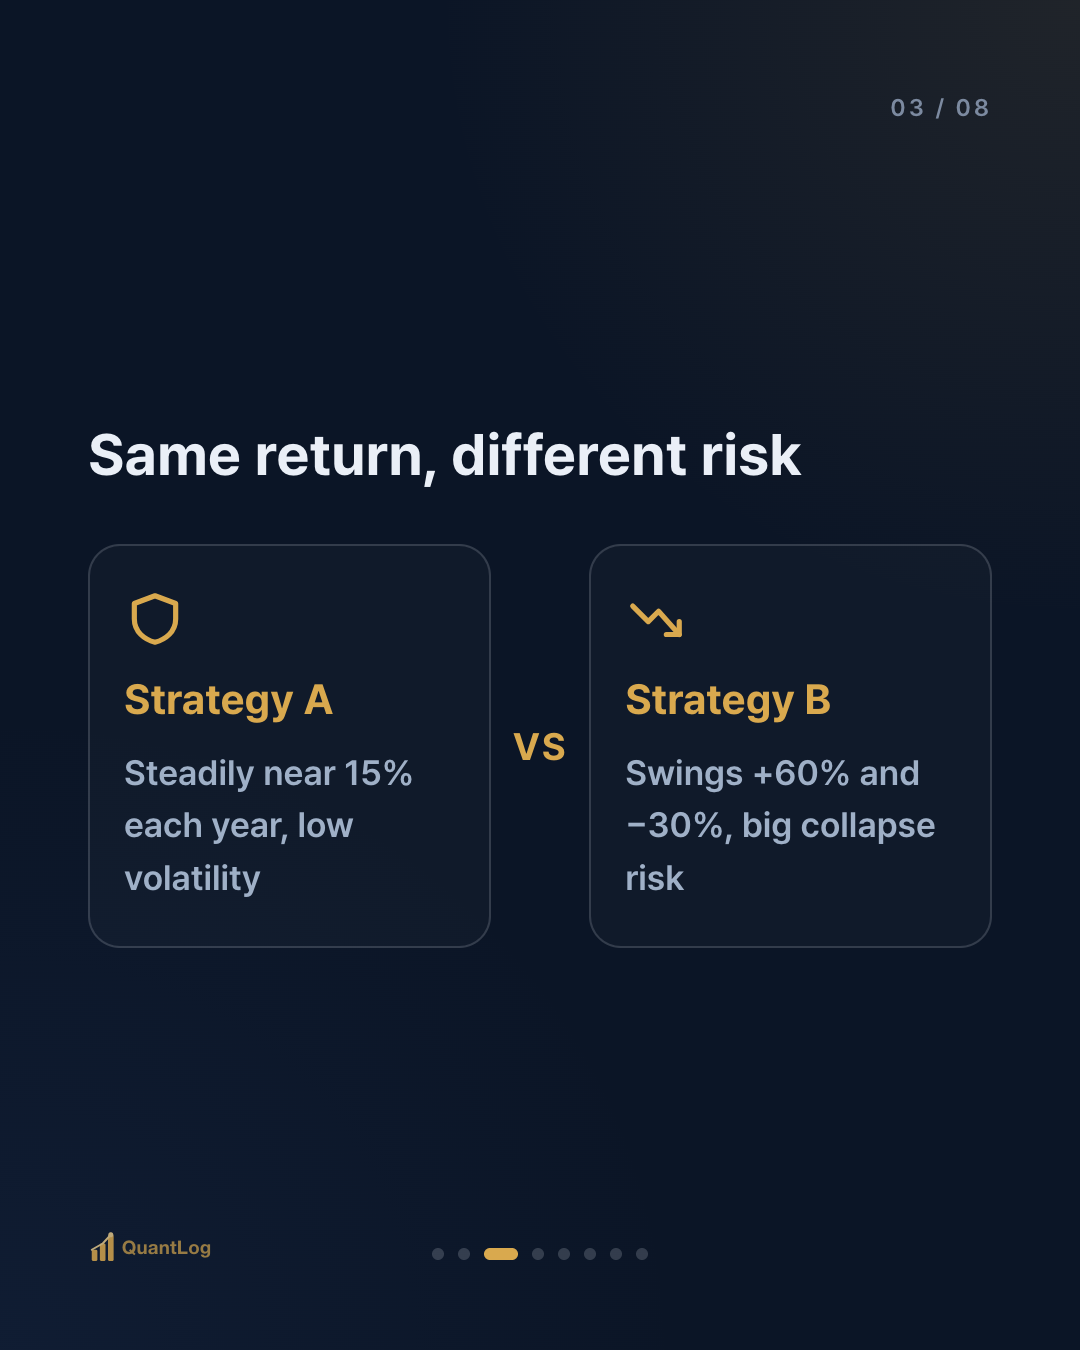
Say two strategies both earned 15% a year. A had low volatility and sat near 15% every year; B swung between +60% one year and −30% another. Even with the same final return, B carries a far greater risk of collapsing partway and being sold out of. The Sharpe ratio rates A higher.
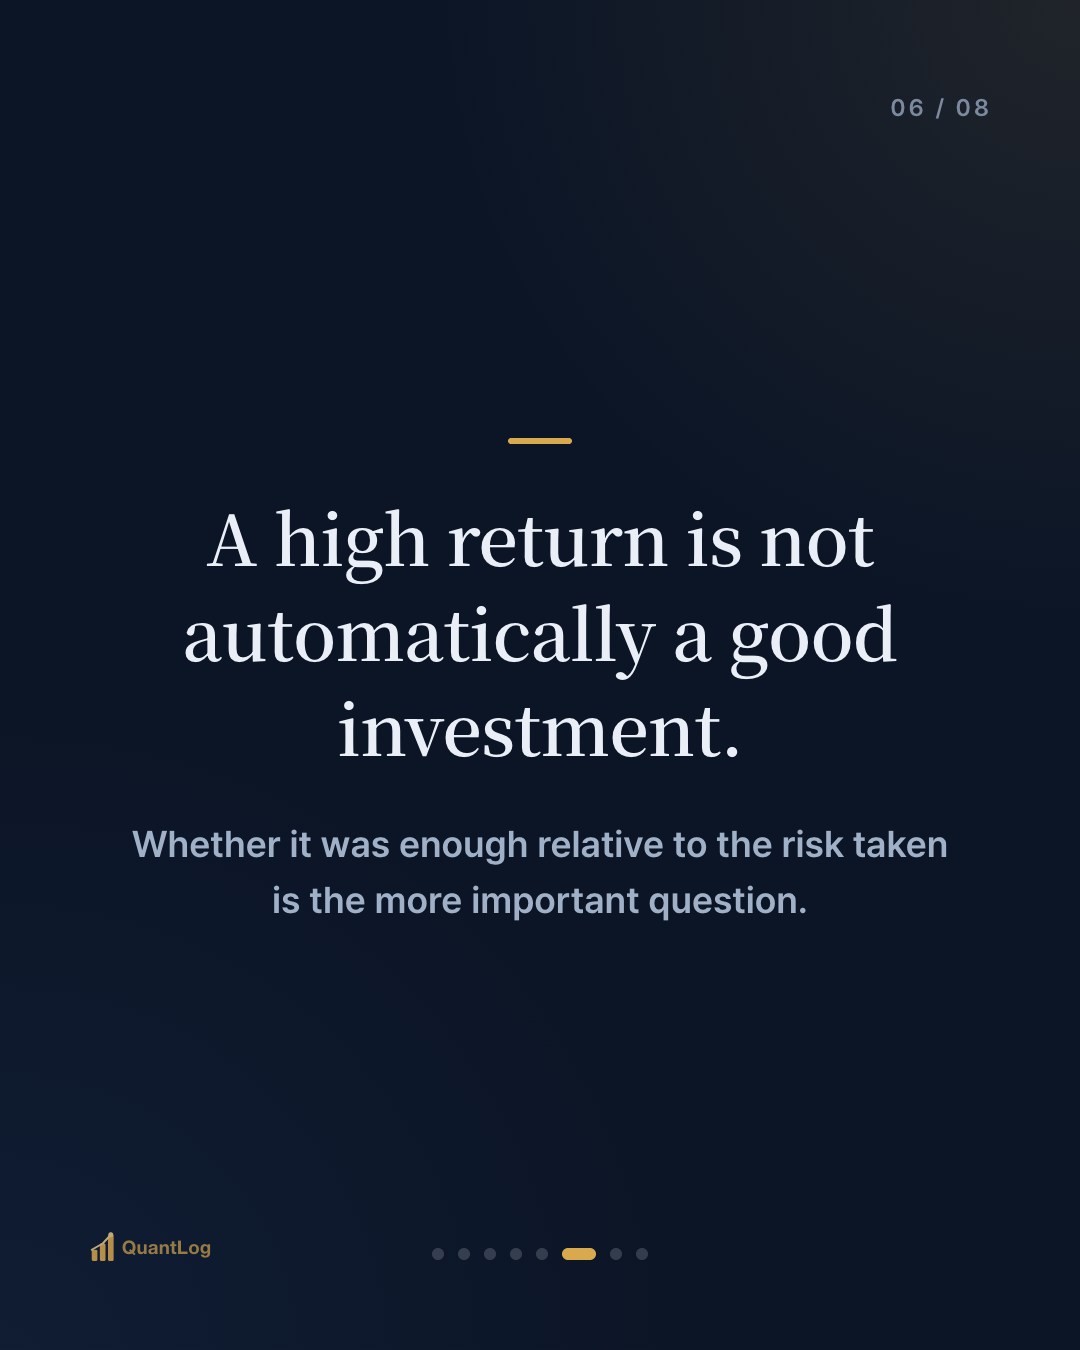
The crux is this. A high return is not automatically a good investment. Whether the return was enough relative to the risk taken is the more important question, and the Sharpe ratio answers it with a number.
How to Read the Number
There's a rough convention for reading the Sharpe ratio. But treat it as an approximation, not an absolute standard.
Roughly, 1 or above is decent, 2 or above is excellent, and 3 or above is very rare. Near 0 or negative means there wasn't excess return to match the risk taken.
This number is most useful as a tool for comparison. It has meaning when you look at "who earned more efficiently" between two strategies computed over the same period, in the same way. Because the value changes a lot with the calculation window and data frequency, comparing Sharpe ratios from different sources at face value is risky.
The Limits of the Sharpe Ratio
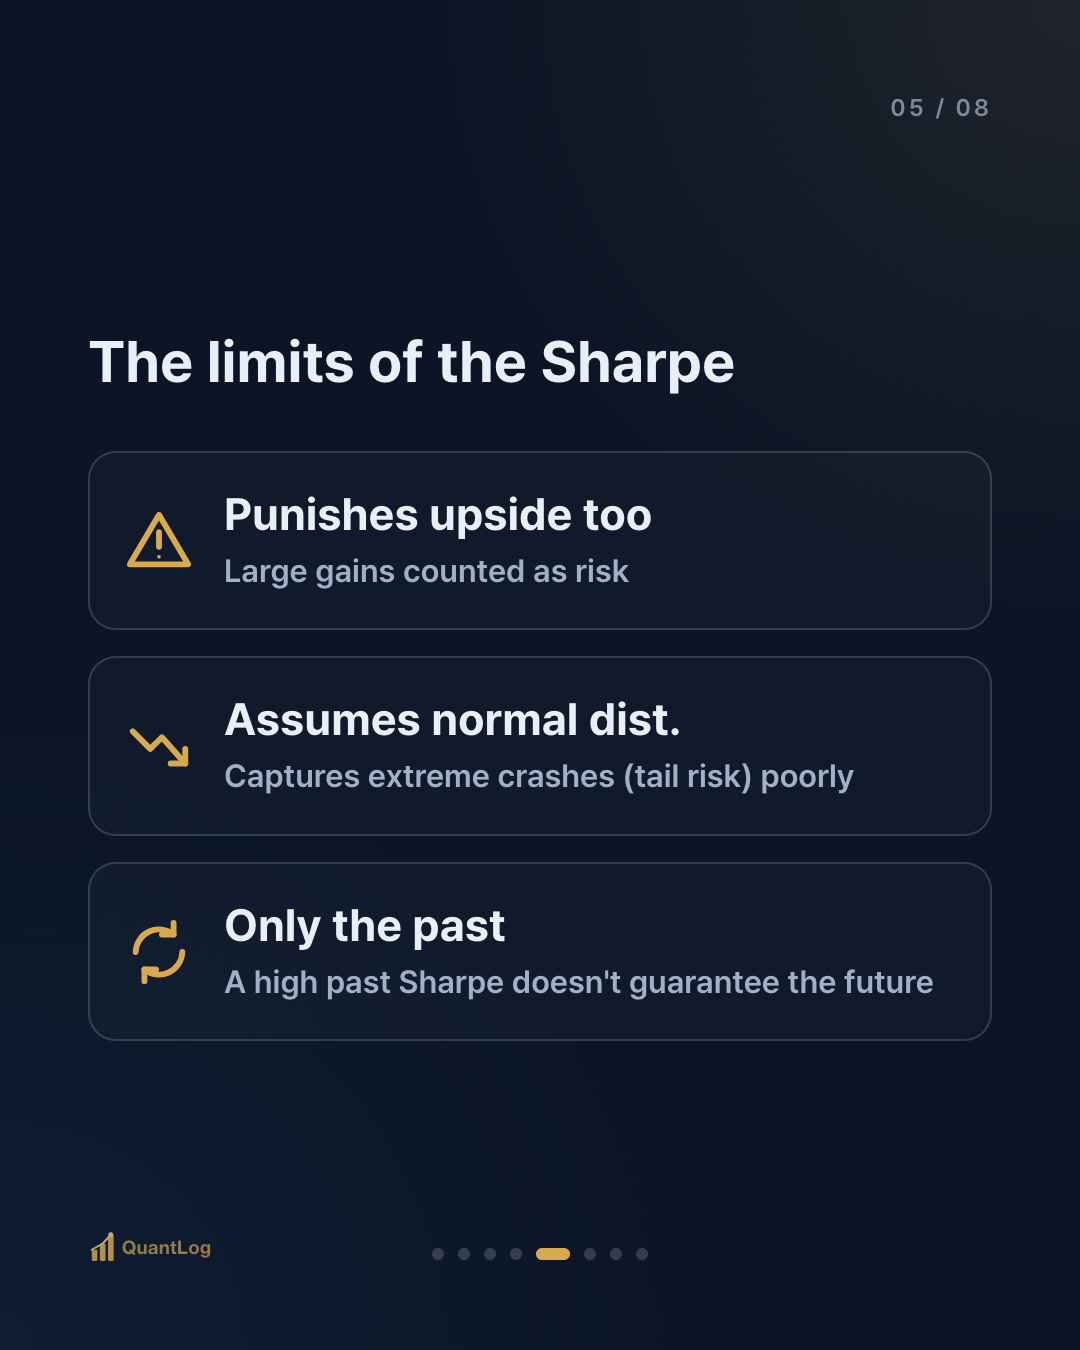
The Sharpe ratio isn't all-powerful either. Three things are worth remembering.
① It punishes upside volatility too. The standard deviation in the denominator doesn't distinguish upward swings from downward ones. Large gains are also counted as "risk" and shave the Sharpe ratio down. But what an investor truly fears is only the downside. The Sortino ratio, which we'll cover next, was made to fix this weakness.
② It assumes a normal distribution. The Sharpe ratio assumes returns spread out in a bell shape, but real markets occasionally bring extreme crashes. It captures this tail risk poorly.
③ It's only the past. As with all indicators, a high past Sharpe ratio does not guarantee good future performance.
To Sum Up
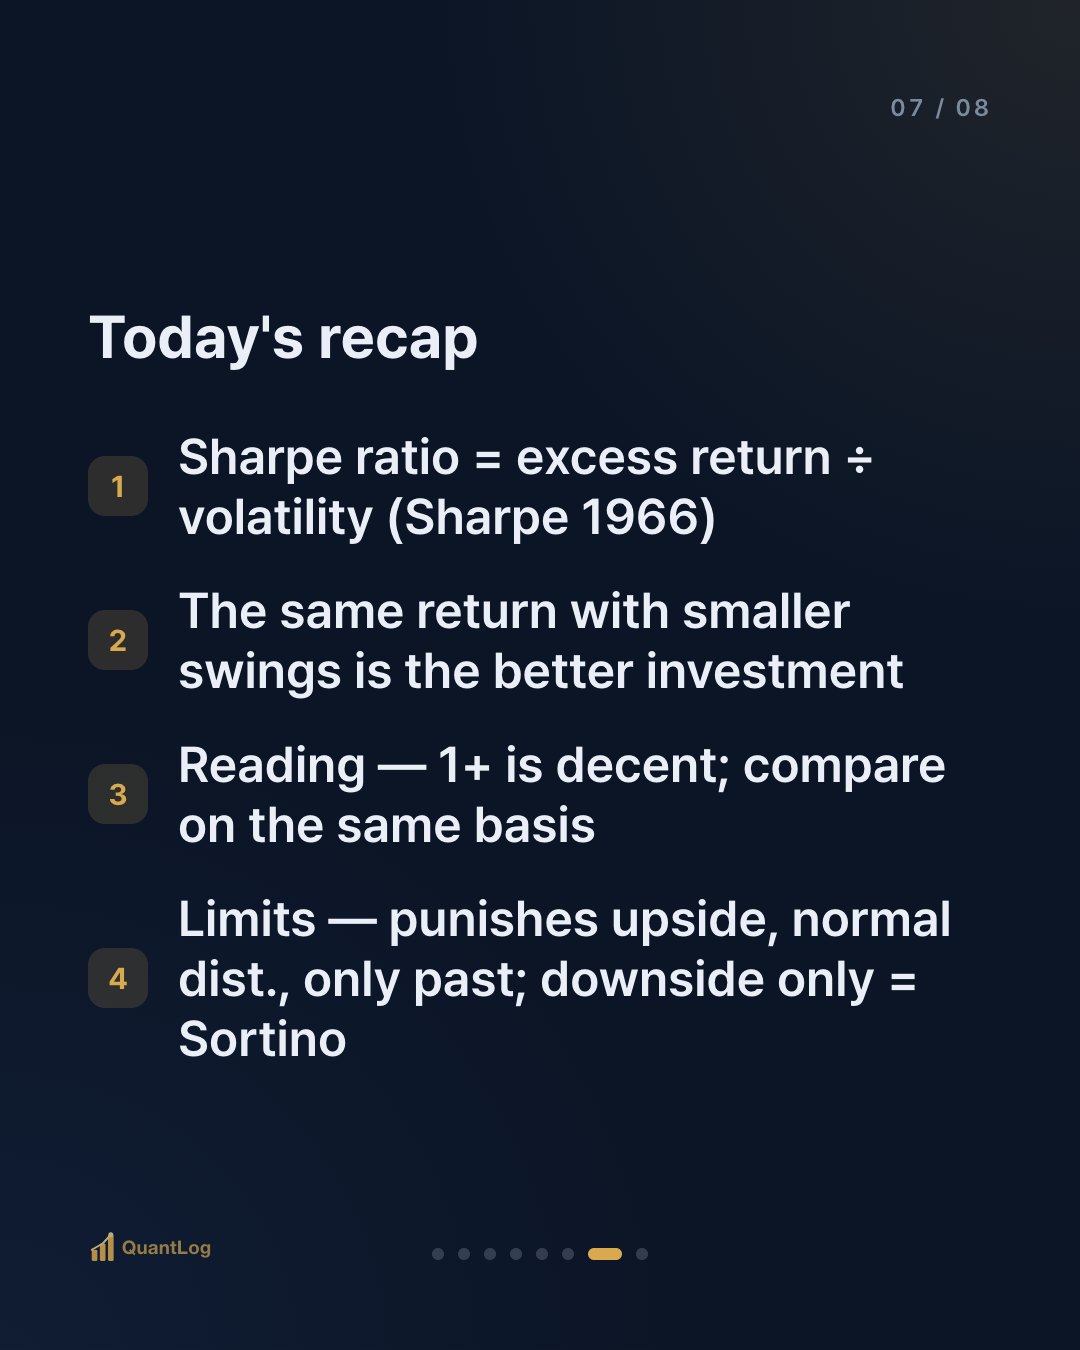
- Sharpe ratio = excess return ÷ volatility. How much you earned per unit of risk taken (Sharpe 1966)
- Return alone isn't enough. The same return earned with smaller swings is the better investment
- Reading it: roughly 1+ is decent, 2+ is excellent. But compare values computed on the same basis
- Limits: it punishes upside too, assumes a normal distribution, and is only the past. For downside only, Sortino (next issue)
An investment's report card doesn't end with the one line of how much you earned. How precarious a road you earned it on has to be written alongside for the evaluation to be complete. The Sharpe ratio is a tool for filling in that second line with a number.
References
- Sharpe, W., "Mutual Fund Performance," *Journal of Business* (1966) — the original Sharpe ratio (then the reward-to-variability ratio)
- Sharpe, W., "The Sharpe Ratio," *Journal of Portfolio Management* (1994) — a restatement of the modern definition
- The concepts of the risk-free rate and standard deviation are the shared foundation of risk-adjusted return indicators

Disclaimer
This article is for informational purposes only and is not investment advice. It is not a recommendation to buy or sell any security. All investment decisions are your own responsibility.

Comments 0
Be the first to comment.