
If you could put only one indicator on a chart, a lot of people would pick RSI. And almost everyone learns it the same way.
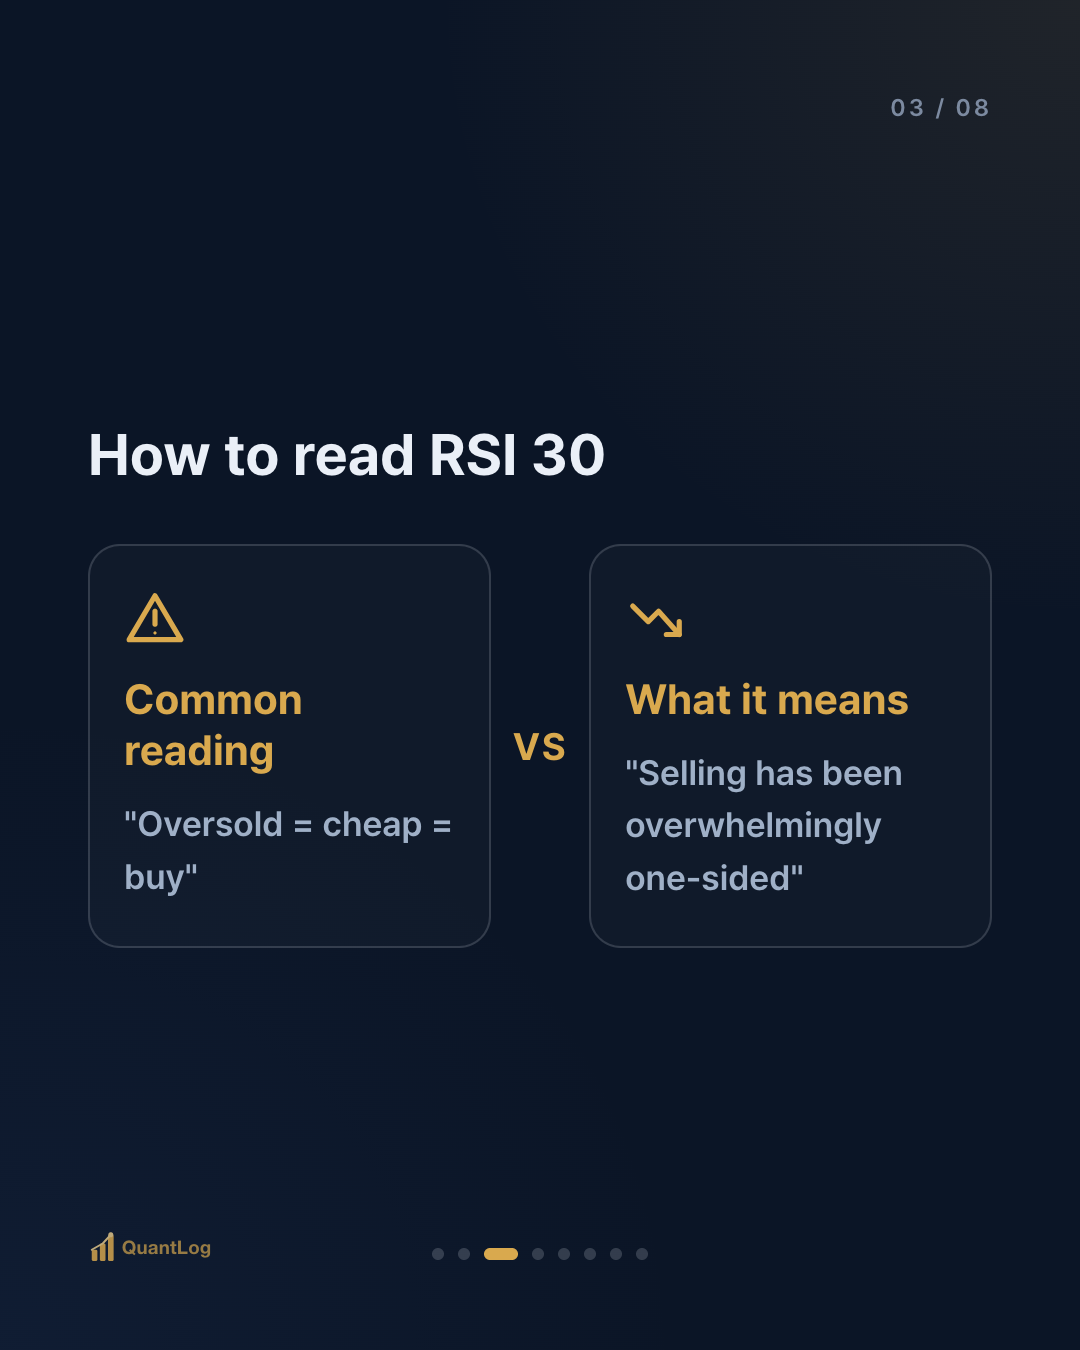
"RSI under 30 means oversold. That means it's cheap. Buy."
That single line is what makes a downtrend expensive. Once you see what RSI actually measures, the reason becomes obvious.
What RSI is, in one sentence
RSI (Relative Strength Index) was introduced by J. Welles Wilder Jr. in his 1978 book *New Concepts in Technical Trading Systems*. The math:
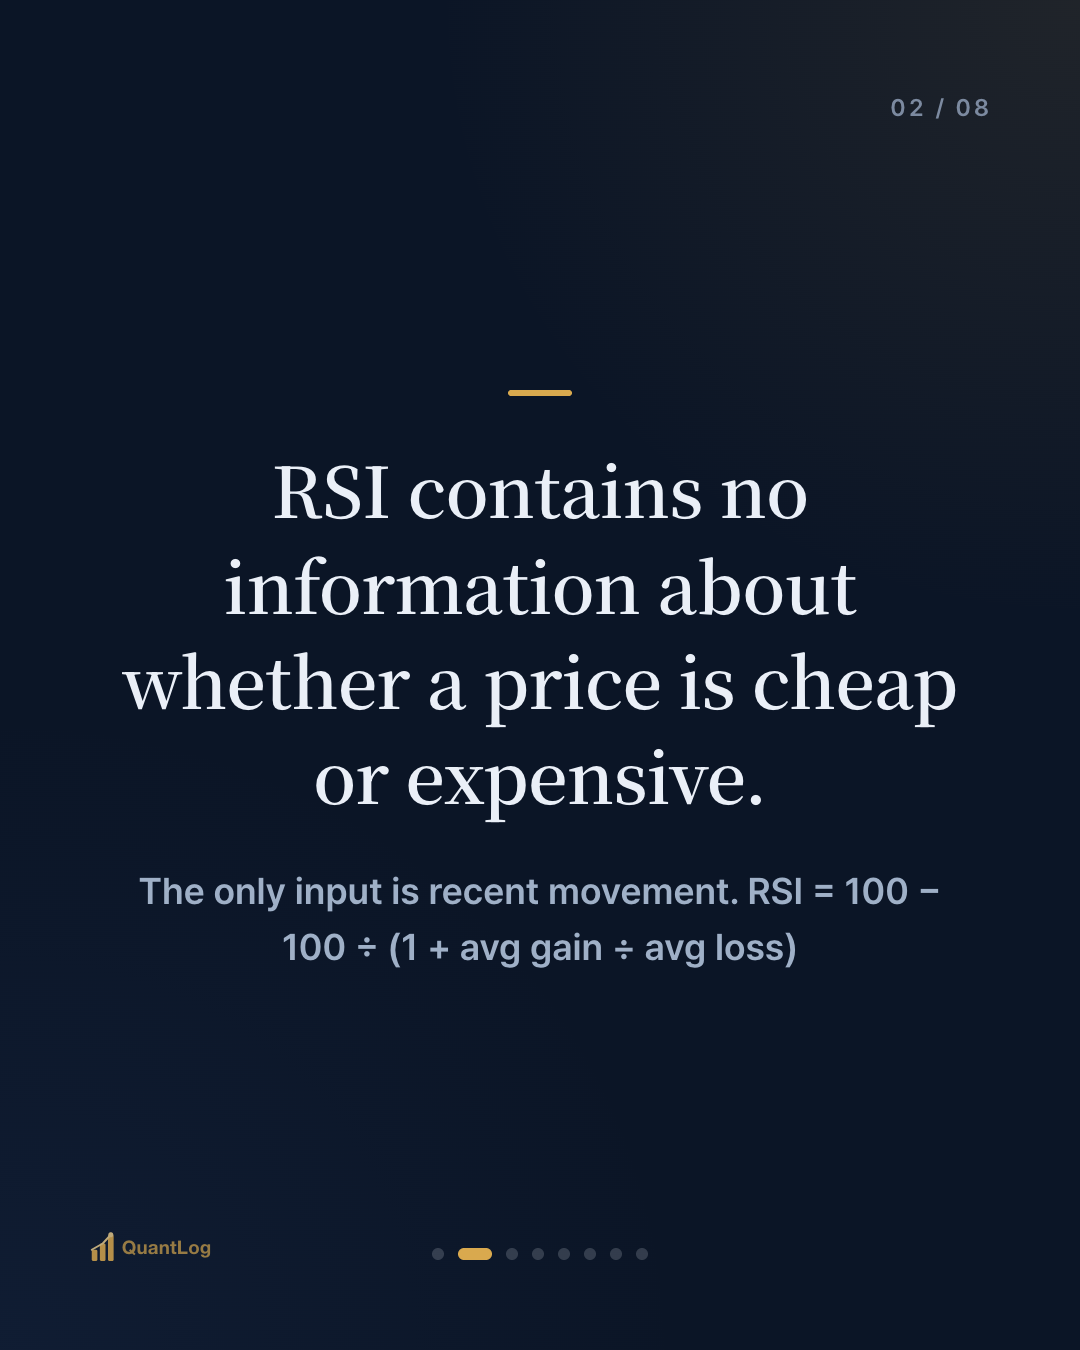
RSI = 100 − 100 ÷ (1 + RS), where RS = average gain ÷ average loss over a set period
The default period, Wilder's own, is 14. In plain language:
"Over the last 14 days, of all the movement, what percentage of the force came from up days?"
Something important is already visible here. RSI contains no information about whether a price is cheap or expensive. No earnings, no fair value, no volume. The only input is how much price moved up versus down recently.
So what does a low RSI actually mean?
RSI below 30 doesn't mean "cheap." It means "over the last 14 days, the downward force has been overwhelmingly one-sided."
Read literally, that flips the conclusion. One-sided selling isn't a reason to buy — it's an observation that the downtrend is strong. The same holds in reverse. RSI above 70 doesn't mean "expensive," it means the uptrend is strong, and in a powerful rally RSI can sit above 70 for weeks.
Where do 30 and 70 come from?
Those are the levels Wilder proposed in the original book. What usually gets dropped is that he didn't treat them as buy and sell buttons. Closer to the original use:
- 30/70 are warning levels meaning "this has become lopsided," not entry signals
- What Wilder weighted more heavily wasn't the level crossing but divergence — price making a new low while RSI refuses to
So touching 30 isn't "buy now." It's "this range is lopsided, so bring another piece of evidence."
Why price keeps falling below 30
Three reasons "under 30 = buy" breaks down.
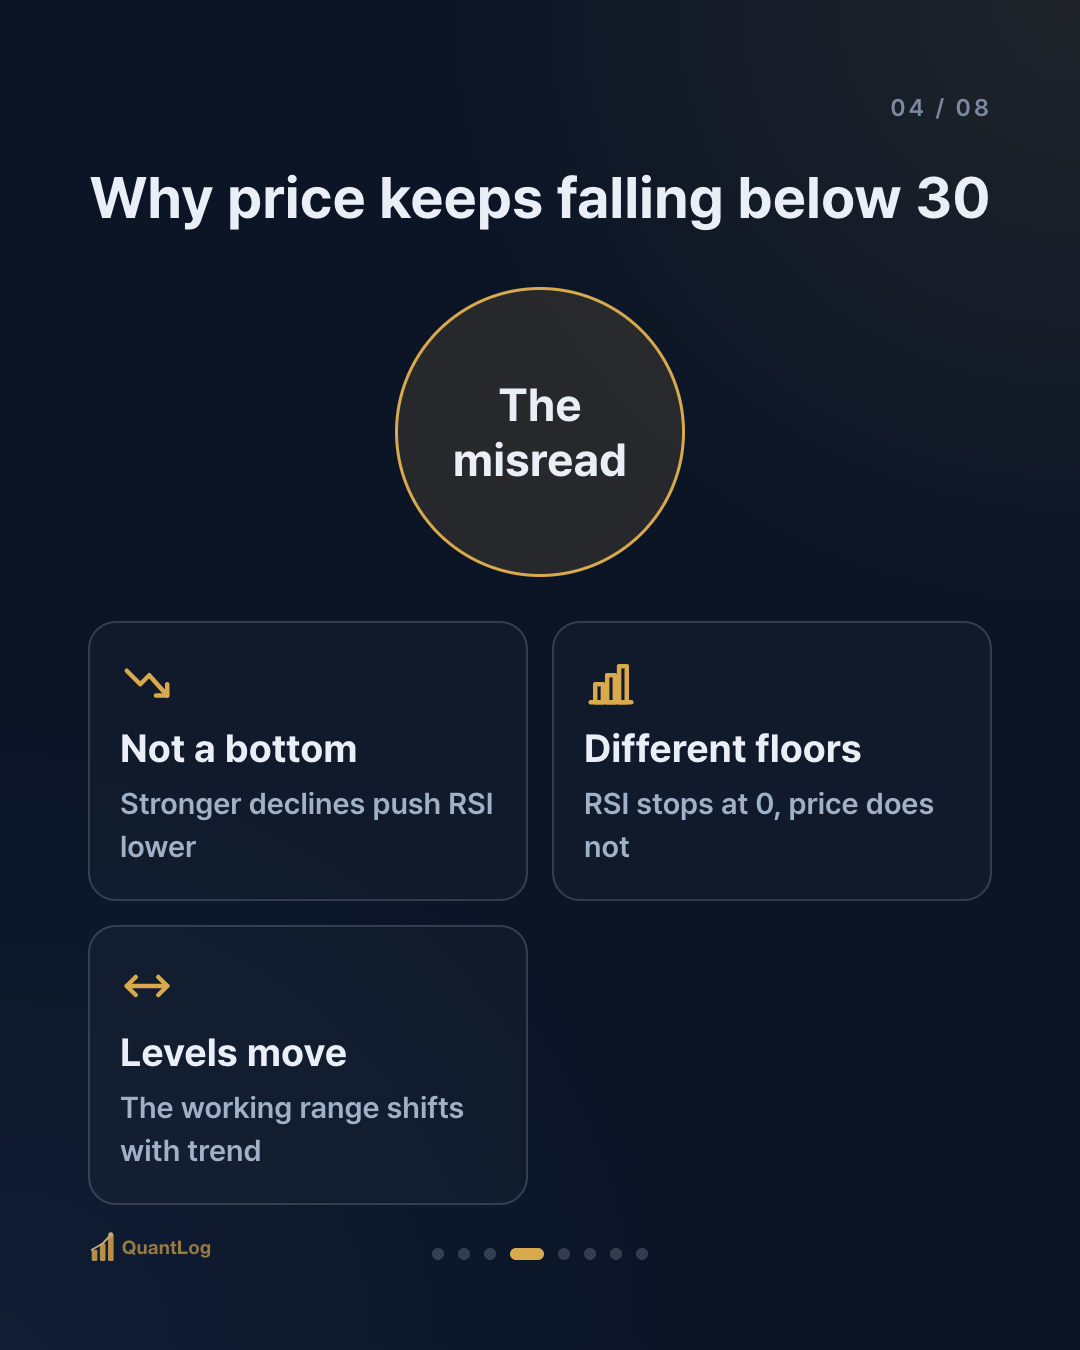
① RSI doesn't measure bottoms. The stronger the decline, the lower RSI goes. So a low RSI doesn't mean selling has weakened — it means exactly the opposite. In a real downtrend RSI pins under 30 for weeks, and price keeps falling the entire time.
② The indicator has a floor. Price doesn't. RSI cannot go below 0, so no matter how long the decline runs, RSI stops looking any worse somewhere around 20–30. Price can keep dropping the whole way down. An indicator hitting its floor is a fact about the indicator, not about the price.
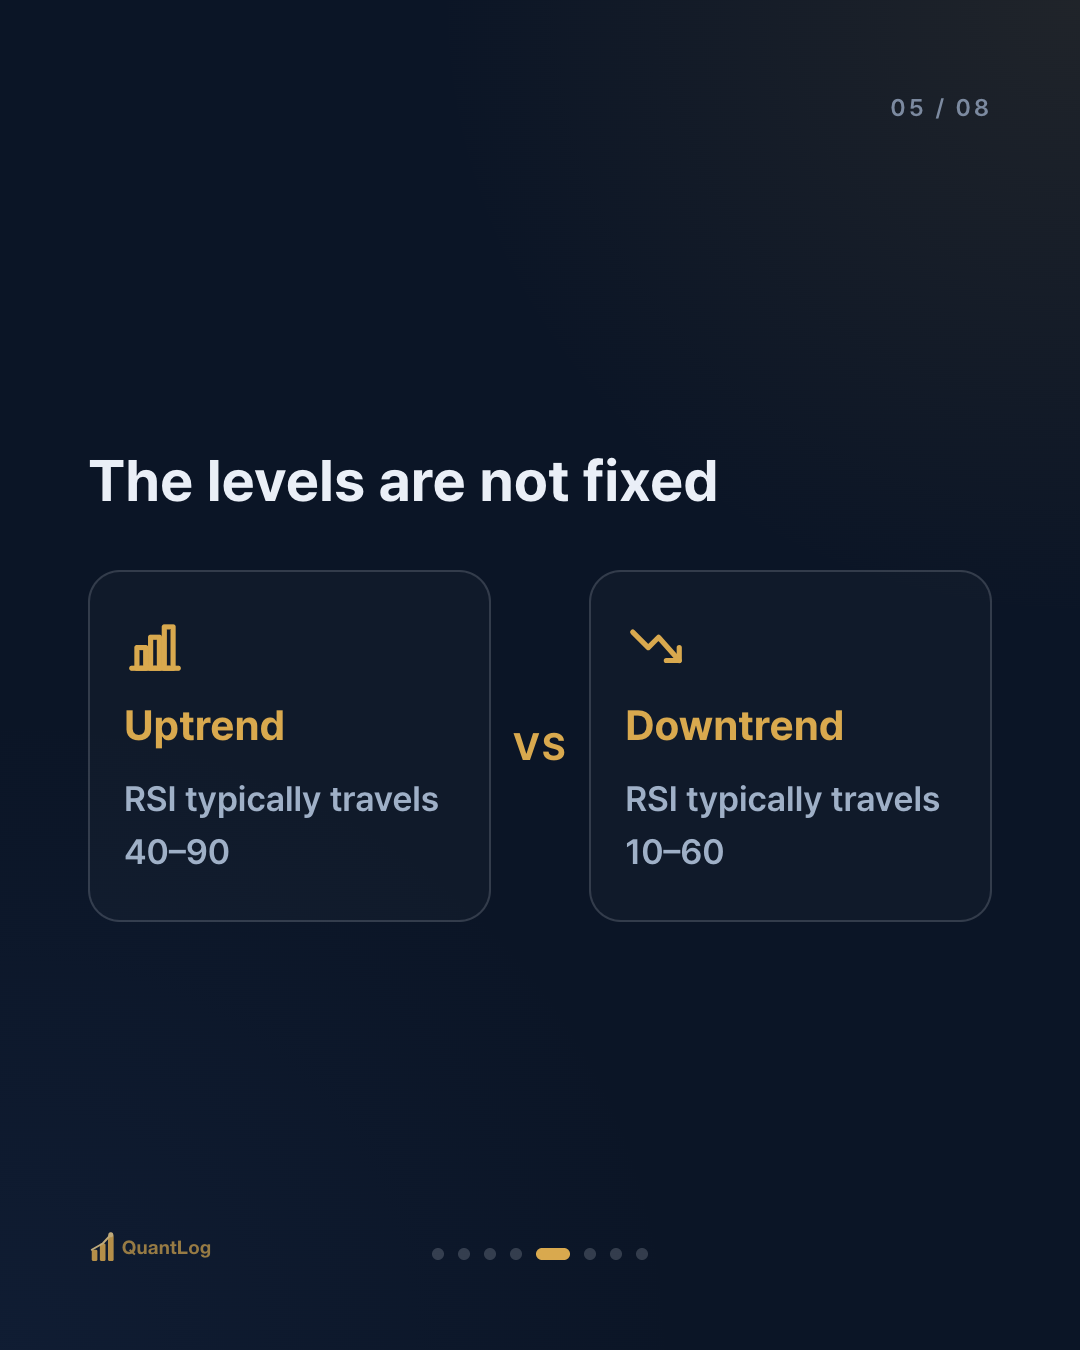
③ The levels move with the trend. In *Technical Analysis for the Trading Professional*, Constance Brown documented that RSI tends to travel roughly between 40 and 90 in an uptrend, and between 10 and 60 in a downtrend. Apply an uptrend threshold (30) to a stock already in a downtrend and you will buy early, every time.
So what is RSI good for?
This isn't an argument for throwing it out. As supporting information rather than a standalone signal, it still earns its place.
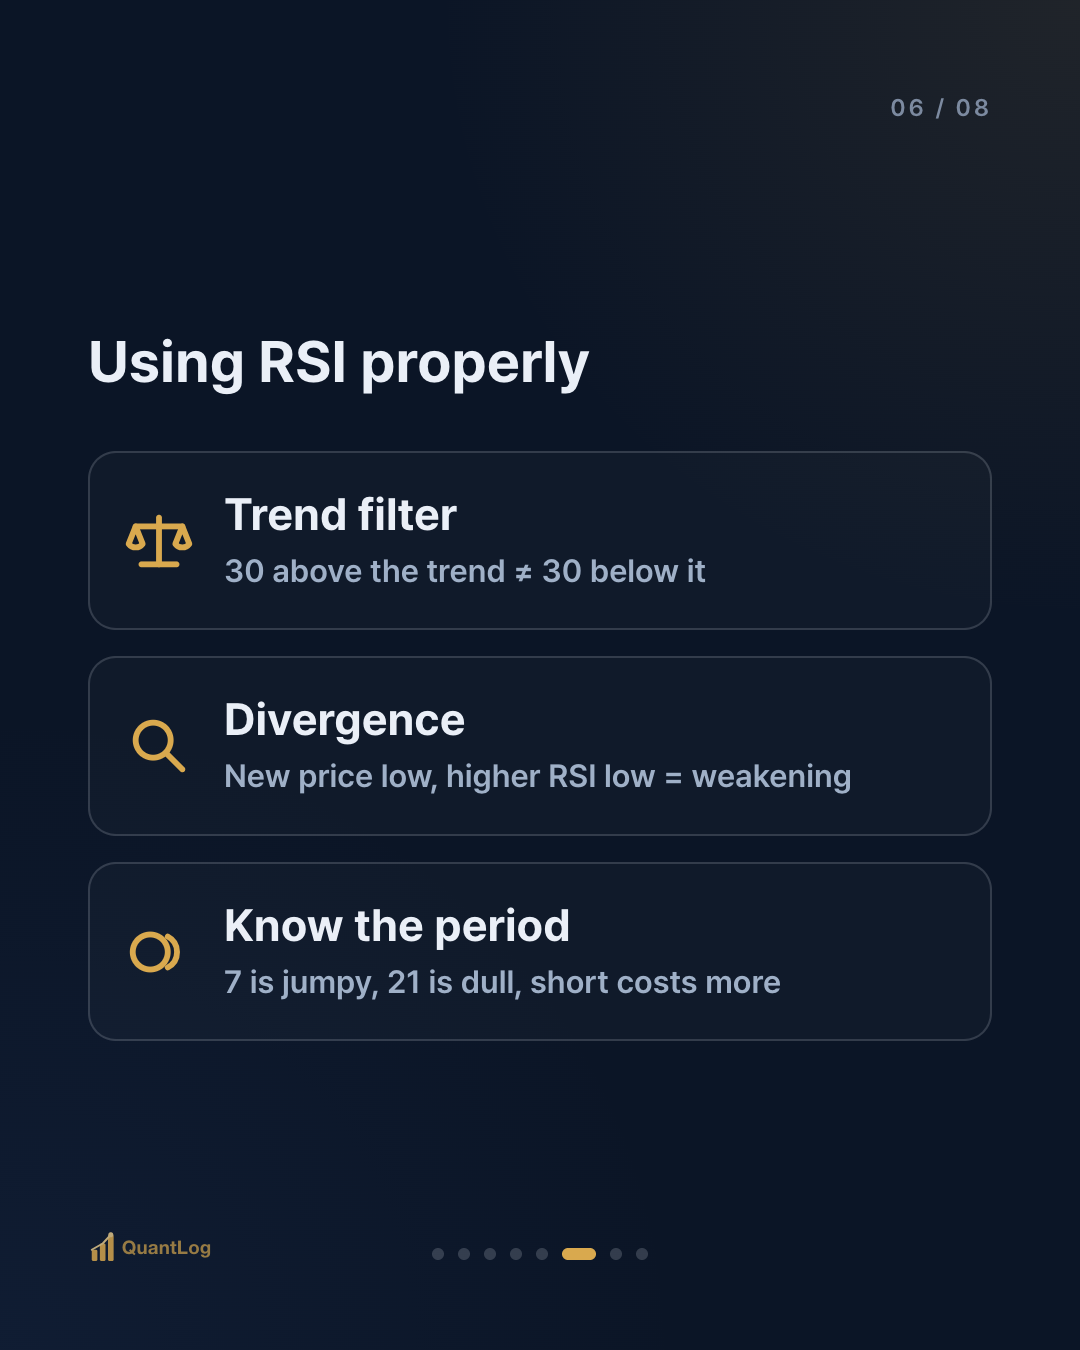
- Pair it with a trend filter. Only act on RSI lows above a long-term moving average; below it, a low RSI isn't an invitation. The same 30 is a different event above the trend than below it.
- Watch for divergence. If price makes a new low but RSI holds above its prior low, the selling force may be weakening. Still not a standalone confirmation.
- Understand the period. Switch 14 to 7 and RSI gets far more sensitive, touching 30 constantly. Switch to 21 and it dulls but fires less. Shortening the period to get more signals doesn't improve results — it just trades more, and costs scale with it.
In short
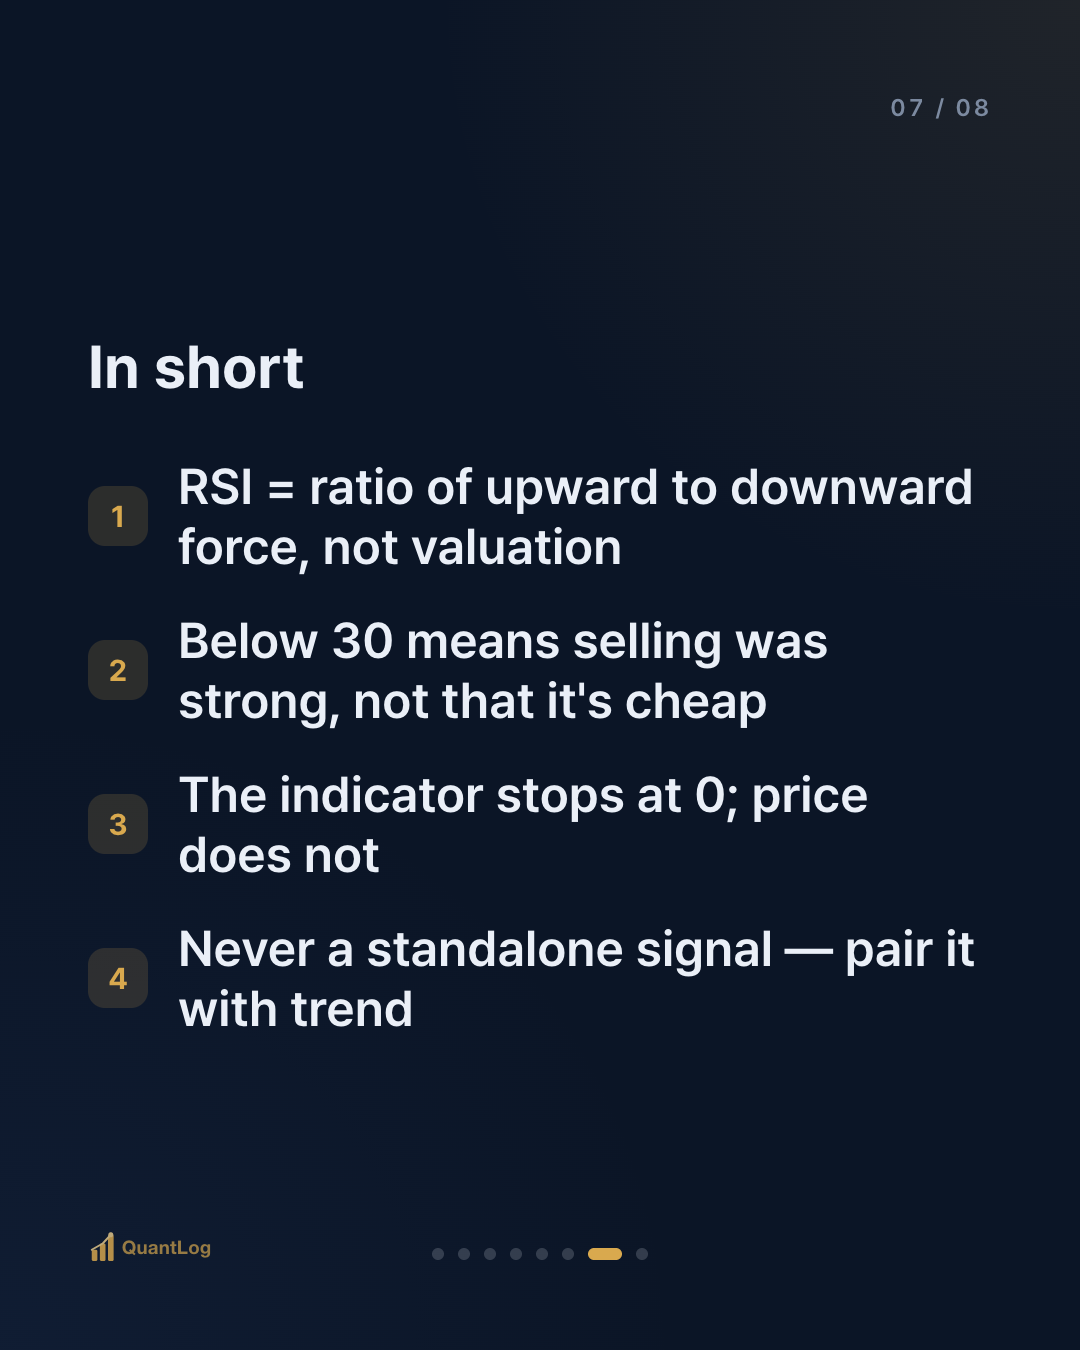
- RSI = the ratio of upward to downward force over a set period (default 14). It says nothing about cheap or expensive
- RSI below 30 doesn't mean cheap. It means selling has been strong — not a buy case on its own
- The indicator stops at 0; price doesn't. In a downtrend RSI stays pinned under 30
- The 30/70 levels aren't fixed. They shift with the trend
- If you use it, use it with a trend filter and with divergence — never alone
An indicator isn't an answer. It's a summary. Losses begin the moment you read the summary as the answer.
References
- J. Welles Wilder Jr., *New Concepts in Technical Trading Systems* (1978) — the original RSI definition, the 14-period default, and the 30/70 levels
- Constance Brown, *Technical Analysis for the Trading Professional* — how RSI's working range shifts with trend

Disclaimer
This article is for informational purposes only and is not investment advice. It is not a recommendation to buy or sell any security. All investment decisions are your own responsibility.

Comments 0
Be the first to comment.