

Conventional wisdom usually says "buy low, sell high." Yet one of the most stubbornly persistent quantitative strategies of the past several decades stands on the opposite side of that advice.
"A stock that has risen recently tends to keep rising for a while."
This is called momentum. It looks like it contradicts intuition, and yet it has been observed again and again across markets, assets, and eras. Today we lay out where this claim came from, why it works, and where it breaks.
What Momentum Is — in One Sentence
Momentum is "the tendency for an asset with high returns over some past window to keep producing relatively high returns in the window that follows." Like inertia in physics, it borrows its name from the tendency of a moving thing to keep going a little further in the same direction.
The key point is that no valuation enters the picture at all. It doesn't look at financial statements or fair value. All it looks at is the price's past path. In this sense momentum asks the opposite question to value investing. Value asks "how cheap is it?"; momentum asks "how well is it running?"

Is It Real? — Where the Evidence Starts
The decisive moment that made momentum an academic subject was a 1993 paper.
- Narasimhan Jegadeesh and Sheridan Titman, writing in the *Journal of Finance* (1993), reported that a portfolio that buys the top past-3-to-12-month return stocks and sells the bottom ones earned statistically significant excess returns over the following 3 to 12 months.
- Mark Carhart (1997) later formalized this effect as the momentum factor (UMD, Up-minus-Down), adding it as a fourth factor explaining fund performance.
- Clifford Asness and colleagues (2013), in "Value and Momentum Everywhere," documented that momentum appears not only in stocks but across multiple asset classes — bonds, currencies, commodities.
So momentum is not the fluke of one market but a fairly robust empirical regularity observed repeatedly across assets and countries. That said, "robust" does not mean "always works." That distinction matters later.
Two Kinds of Momentum

Momentum splits into two branches. Mixing them up is where conversations often tangle.
① Cross-sectional momentum — "relative comparison." You line up many stocks at the same point in time, buy the top performers, and sell the bottom ones. This is what Jegadeesh and Titman studied. It asks "who ran better than the others?"
② Time-series momentum — "compared to itself." If a single asset has risen against its own recent past, you hold it; if it has fallen, you step aside. It asks "is this asset running better than its own past?" This overlaps with trend following.
Both use "what rose keeps rising," but the benchmark differs. One is comparison to others, the other is comparison to one's own past.
Why Does This Happen?

There are two broad explanations for why winners keep winning, and the matter is not yet fully settled.
The behavioral-finance side (underreaction and herding). People don't react to new information all at once; they price it in gradually. Even after good earnings, a price often doesn't jump to its full level immediately but drifts up over days and weeks. This "slow absorption" window looks like momentum. On top of it, herding — chasing the rise late after seeing it — pushes the trend further.
The risk-premium side. Here the view is that momentum's returns aren't free but the payoff for bearing a rare but large loss. In fact, momentum tends to earn steadily most of the time and then break badly all at once when the market sharply reverses. That is, it's "the price of carrying a risk."
The two explanations aren't mutually exclusive. The important practical implication is this — momentum is not a free lunch; it is inseparable from a tendency to produce large losses in certain regimes.
Where It Breaks — the Honest Limits
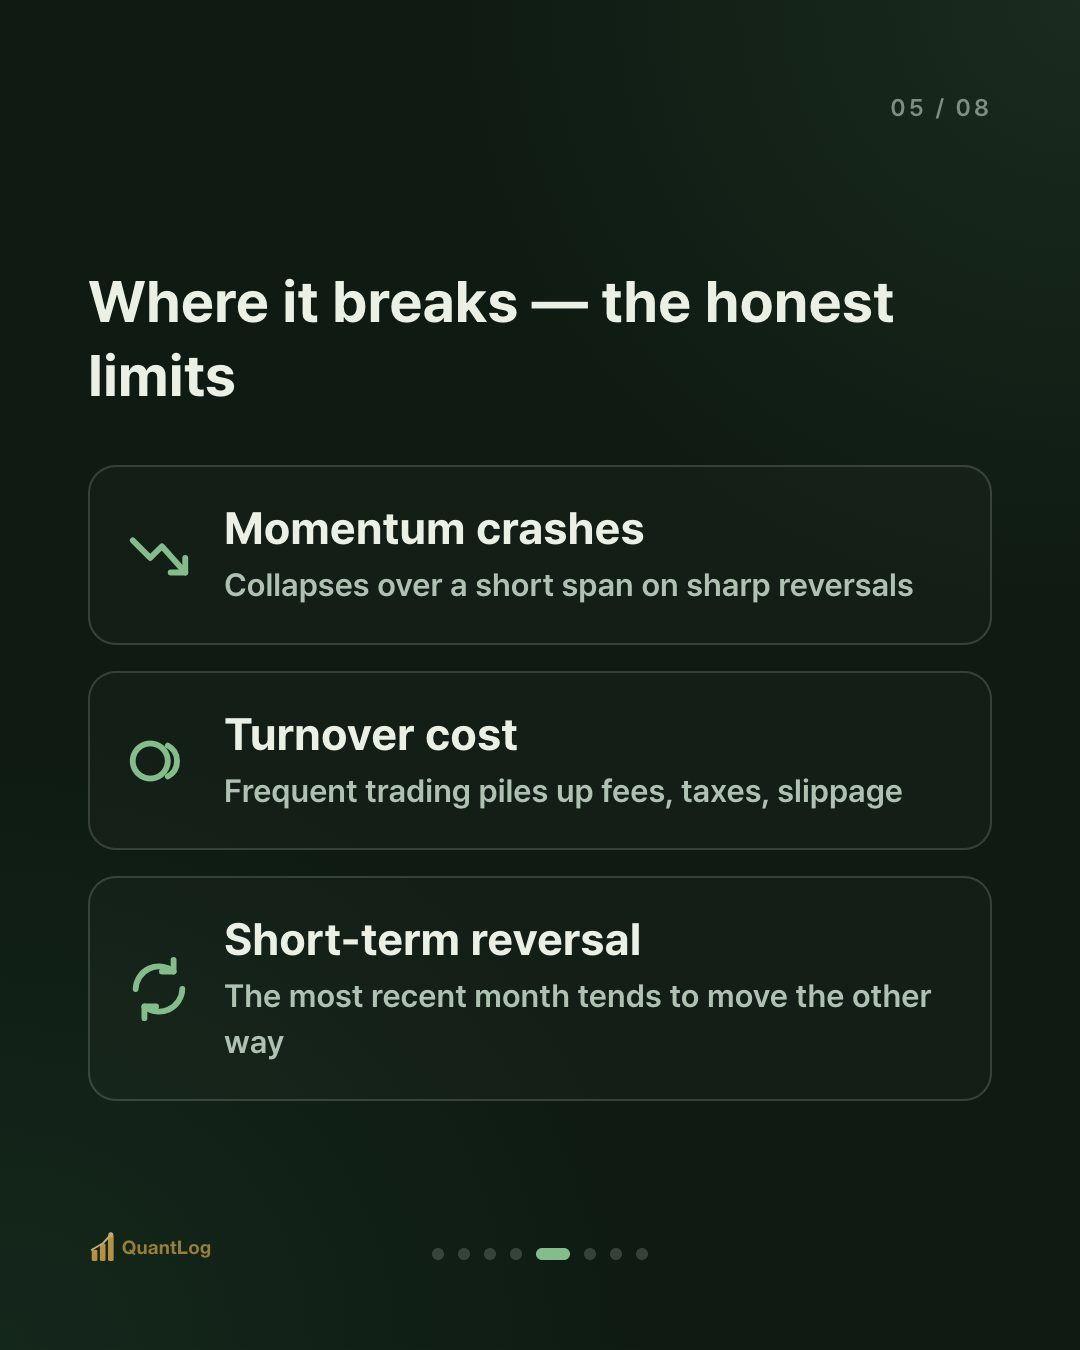
Simplify momentum into "just buy what went up" and you get hurt at three points.
① Momentum crashes. When a long-falling market sharply rebounds, a momentum portfolio collapses over a short span. Daniel and Moskowitz (2016) documented this in "Momentum Crashes." The early-2009 rebound is a frequently cited example. The steady returns of normal times can be handed back all at once in a few of these plunges.
② Transaction costs and turnover. Because rankings change often, momentum requires frequent buying and selling. High turnover piles up commissions, taxes, and slippage, widening the gap between the gross returns in a paper and the net returns you actually keep. It's one of the strategies where "paper performance" and "account performance" diverge the most.
③ Short-term reversal. Over very short windows (roughly the most recent month), the tendency actually reverses. That's why momentum research usually computes past returns "skipping the most recent month." In other words, how you slice the window can flip the signal to its opposite.

To Sum Up
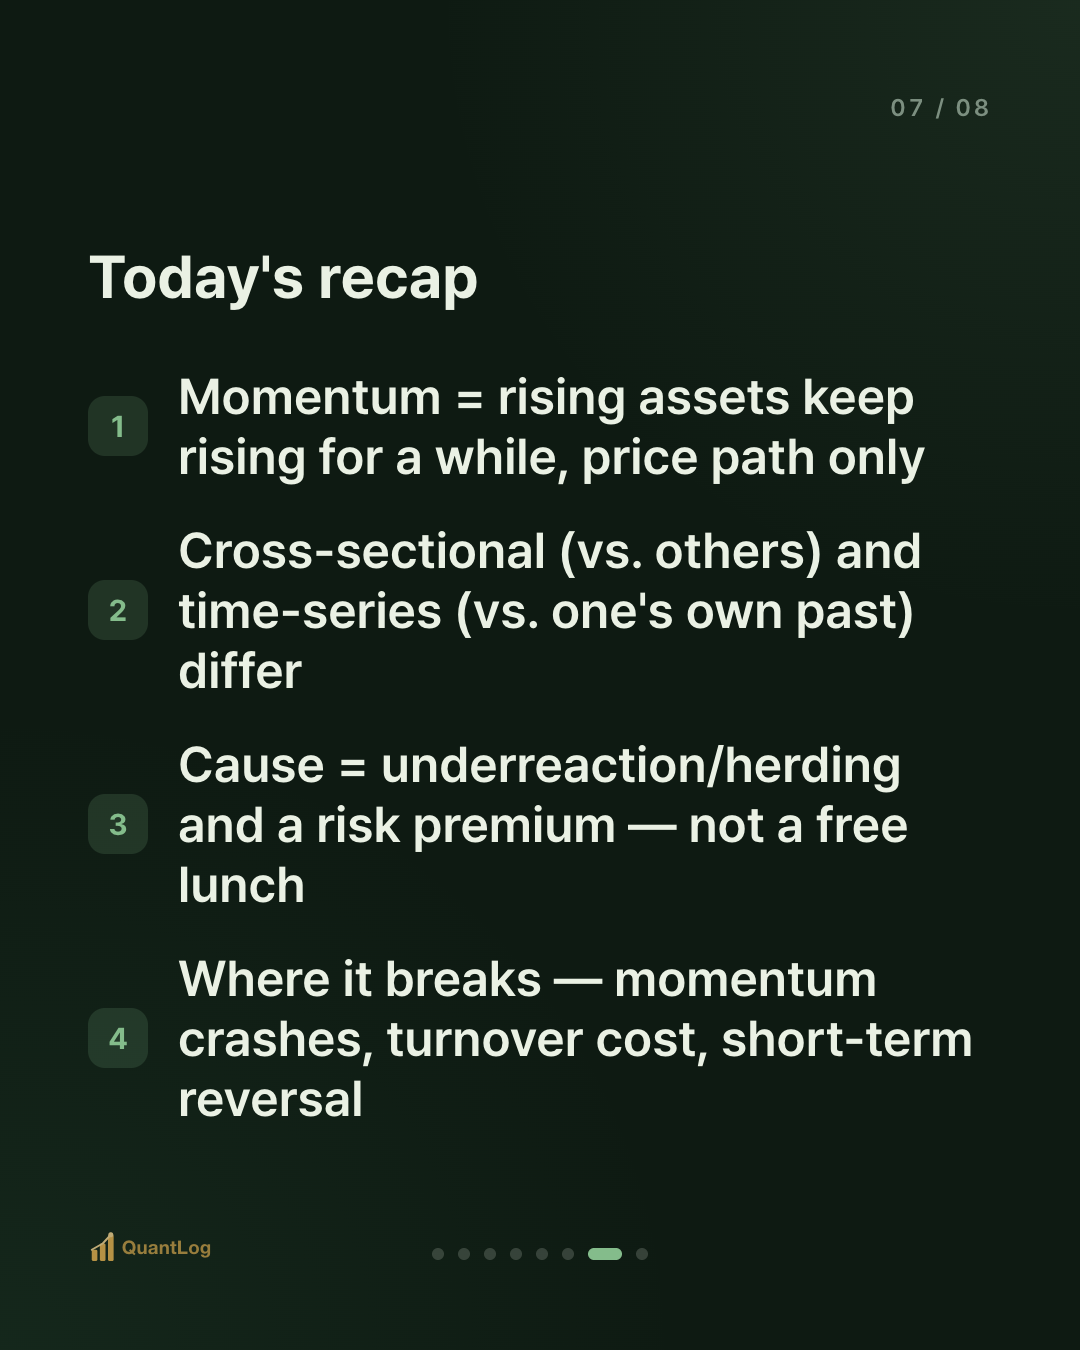
- Momentum = the tendency for recently rising assets to keep rising for a while. It looks only at the price path, not at valuation
- Since Jegadeesh-Titman (1993) it's a robust regularity observed across assets and countries — but "robust" is not "always"
- Cross-sectional (vs. others) and time-series (vs. one's own past) are different concepts
- The cause is explained by underreaction/herding (behavioral) and a risk premium — it is not a free lunch
- Where it breaks: momentum crashes, high turnover cost, short-term reversal
The inertia of "winners keep winning" is real, but you only get the full picture once you include the losses at the moment that inertia suddenly snaps. Half of a strategy is not the return — it's knowing when and how it breaks.
References
- Jegadeesh, N. & Titman, S., "Returns to Buying Winners and Selling Losers," *Journal of Finance* (1993) — evidence for cross-sectional momentum
- Carhart, M., "On Persistence in Mutual Fund Performance," *Journal of Finance* (1997) — the momentum factor (UMD)
- Asness, C., Moskowitz, T. & Pedersen, L., "Value and Momentum Everywhere," *Journal of Finance* (2013) — momentum across asset classes
- Daniel, K. & Moskowitz, T., "Momentum Crashes," *Journal of Financial Economics* (2016) — large losses in sharp-reversal regimes

Disclaimer
This article is for informational purposes only and is not investment advice. It is not a recommendation to buy or sell any security. All investment decisions are your own responsibility.

Comments 0
Be the first to comment.