
Open a stock chart and, below the price, you'll see two lines and a set of bars rising and falling like waves. That's MACD. You often hear "MACD just made a golden cross — buy signal," but once you look at what this indicator actually calculates, the story shifts a little.
Today we lay out what kind of line MACD is, what you can read from it, and where it fools people.
What MACD Is — in One Sentence
MACD (Moving Average Convergence Divergence) is an indicator that plots "the distance between a fast moving average and a slow moving average." Gerald Appel devised it in the late 1970s.
The conventional default settings are these:
- MACD line = 12-day exponential moving average − 26-day exponential moving average
- Signal line = 9-day exponential moving average of the MACD line
- Histogram = MACD line − signal line
So MACD is not new information but a moving average processed one more time. That's the crux. If a moving average is a lagging indicator, then MACD — built by subtracting two of them — is lagging by birth.
Three Components
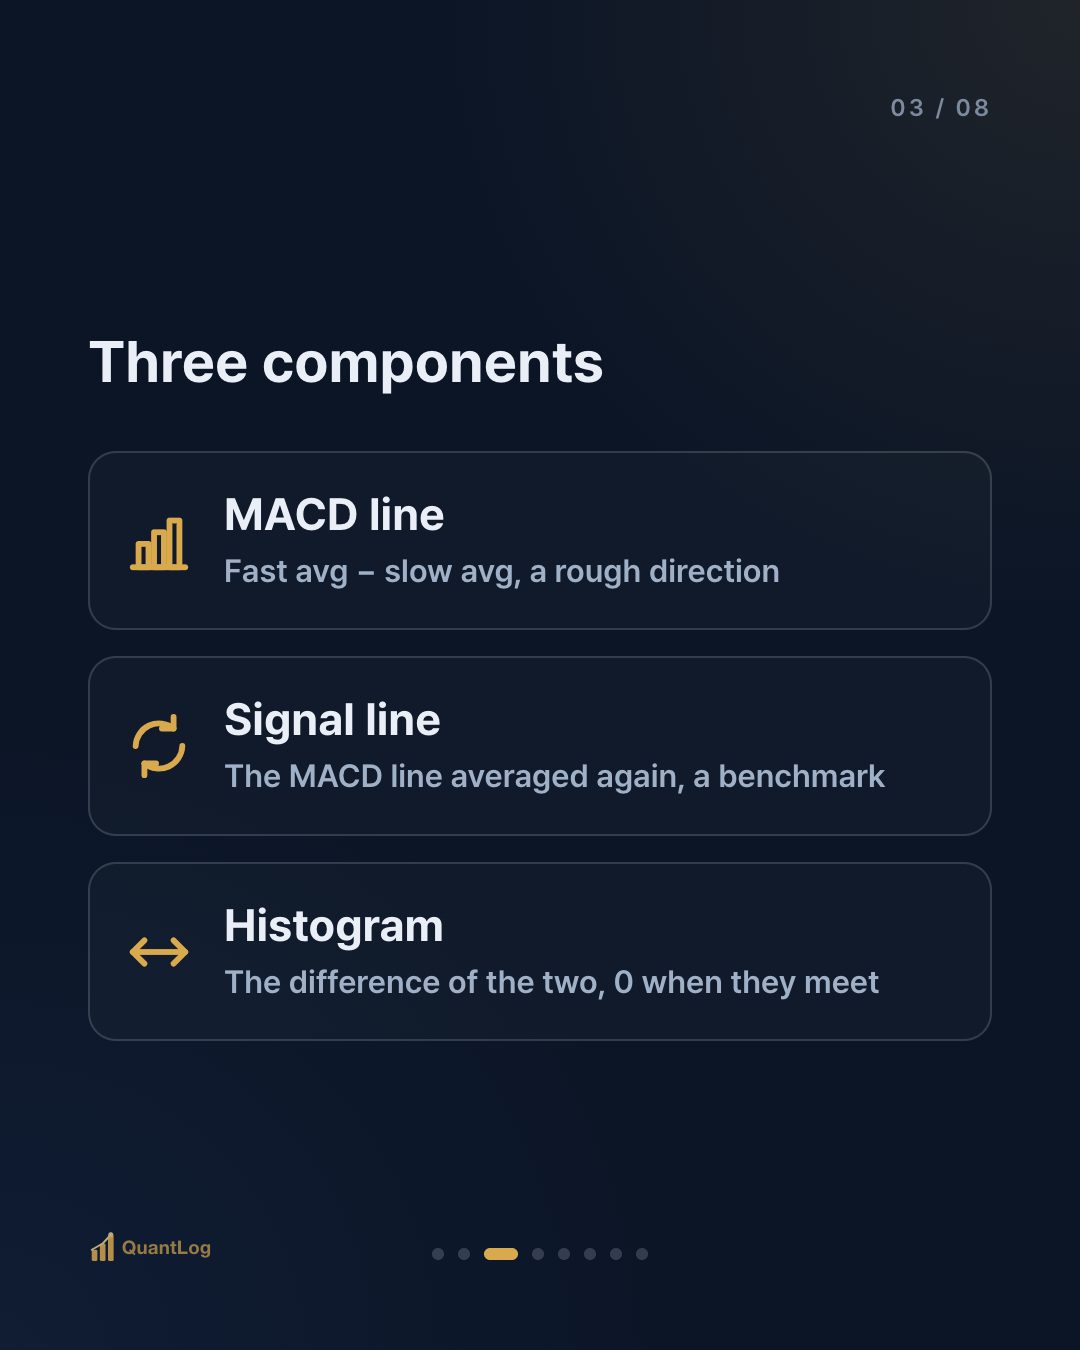
The MACD panel is made of three parts. Separating them makes signals easier to read.
① The MACD line. The fast average minus the slow average. Above 0 it suggests the recent trend leans up; below 0, down — a rough sense of direction.
② The signal line. A slower line, the MACD line averaged again. It acts as a benchmark that smooths the MACD line's sharper moves.
③ The histogram. Bars drawn from the difference between the MACD line and the signal line. When the two lines spread apart the bars grow; when they close in, the bars shrink. At the moment the two lines meet, the histogram is 0.
How to Read the Signals
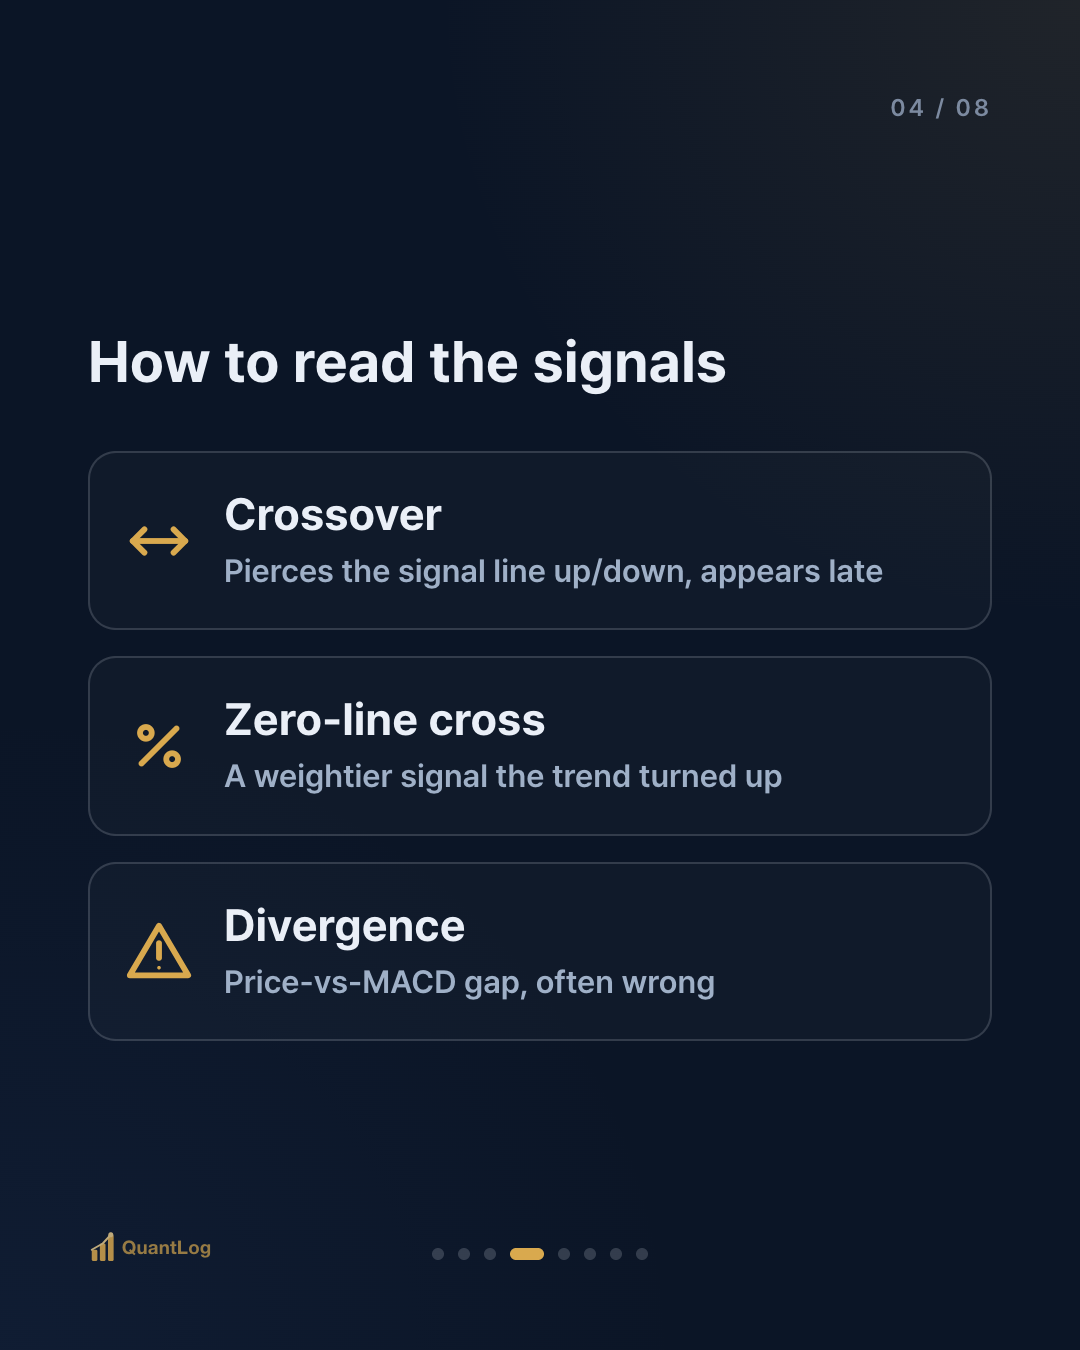
Three signals are commonly watched with MACD. But none of them is a "button."
Crossover. When the MACD line pierces the signal line from below, it's read as bullish; from above, bearish. Same logic as a moving average's golden/dead cross — and, likewise, it appears late.
Zero-line cross. When the MACD line crosses above 0, the fast average has overtaken the slow one — read as a larger signal that the trend has turned up. Slower than a crossover, but weightier.
Divergence. If price makes a new high but MACD fails to follow, it's read as a warning that upward momentum is weakening. The reverse holds too. But divergence appears late, and often wrong, so using it as a standalone signal is risky.
The Honest Limits
Simplify MACD into "trade when a cross appears" and you get hurt at three points.
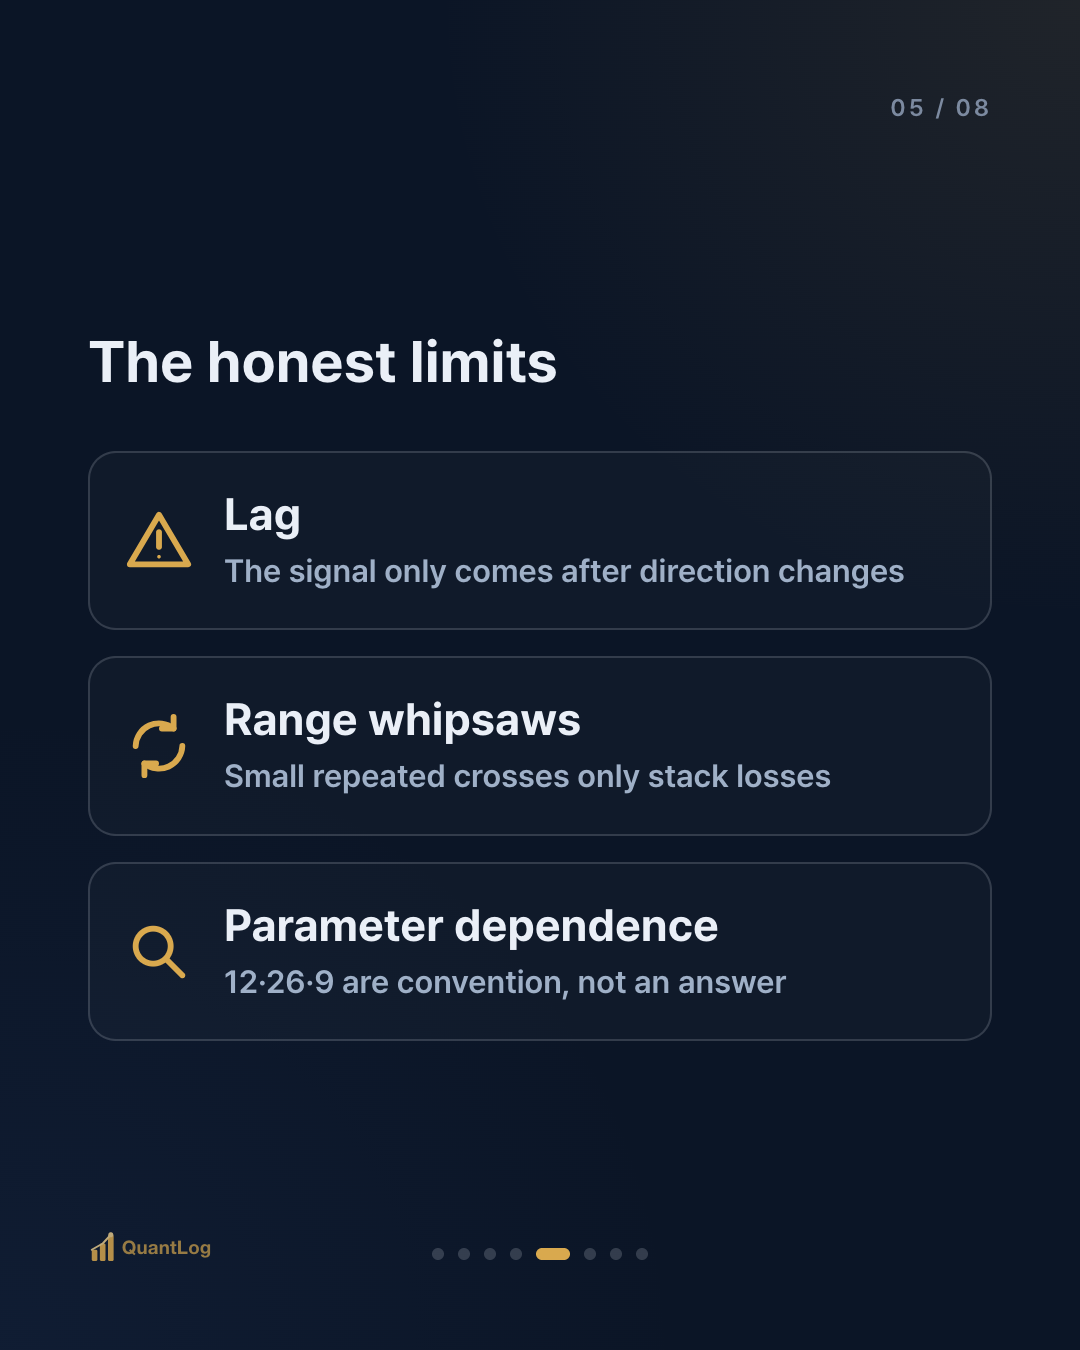
① Lag. Because MACD is a processed moving average, the signal only appears after direction has actually changed. By the time a cross prints, price has often already moved a good deal.
② Whipsaws in a range. In a directionless, choppy stretch, the MACD line and signal line cross back and forth in tiny increments. Trade each one and you only stack up losses. It's useful when the trend is clear and fools you most when there isn't one.
③ Parameter dependence. 12, 26, and 9 are just conventional defaults, not laws of nature. Depending on the security and timeframe, they fit well, or not at all. There is no "these numbers always work" answer.

To Sum Up
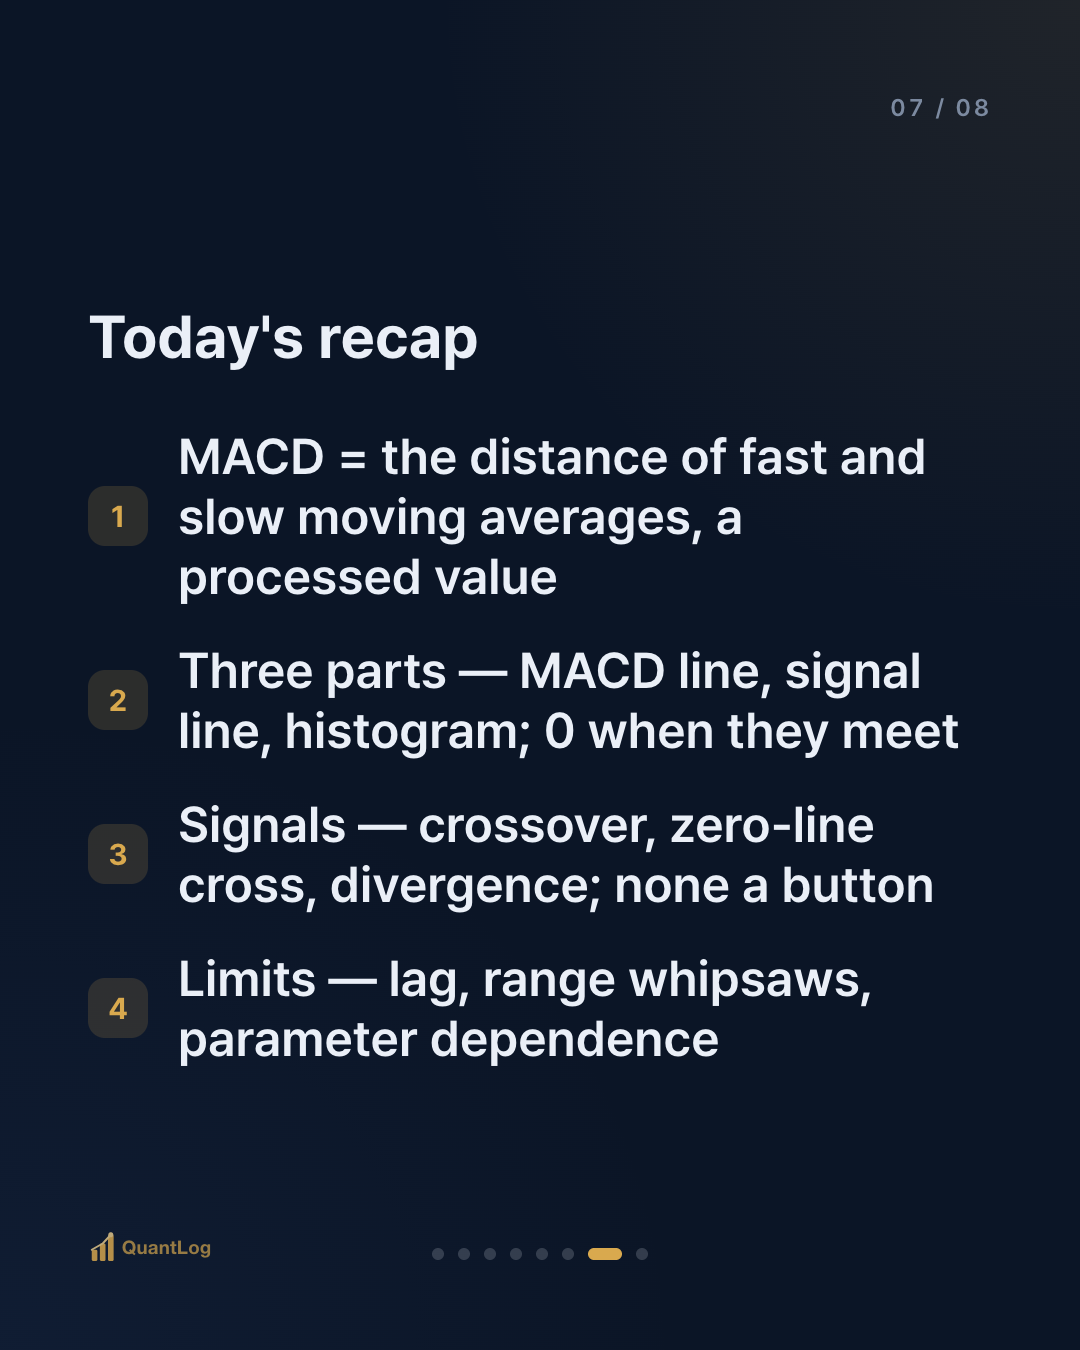
- MACD = an indicator plotting the distance between a fast and a slow moving average. Not new information, but a processed value
- Three components: the MACD line, signal line, and histogram. When the two lines meet, the histogram is 0
- Signals: crossover, zero-line cross, divergence — none is a button
- Limits: lag, whipsaws in a range, parameter dependence. Useful when the trend is clear, deceptive when it isn't
MACD is a tool for confirming direction, not for prophesying the future. Read the moment the two lines meet as a signal — but it's safer to remember, at the same time, that the signal is a late confirmation of a move that has already happened.
References
- Appel, G., *Technical Analysis: Power Tools for Active Investors* (2005) — the definition and components of MACD
- Appel, G., *The Moving Average Convergence-Divergence Trading Method* (1979) — the original MACD method
- The lag of the exponential moving average (EMA) is a property shared across moving-average indicators (see 0007, moving averages)

Disclaimer
This article is for informational purposes only and is not investment advice. It is not a recommendation to buy or sell any security. All investment decisions are your own responsibility.

Comments 0
Be the first to comment.