
Look at a chart and your eyes go almost entirely to price. Yet below the price bars, there's nearly always a second bar graph laid out. That's volume. You often hear "volume spiked," but what it actually tells you tends to stay blurry.
Today we lay out what volume is, why you should read it as price's partner, and where the misreadings come from.
What Volume Is — in One Sentence
Volume is the number of shares that actually changed hands over a given period. If a day's volume is one million shares, one million shares were bought and sold that day.
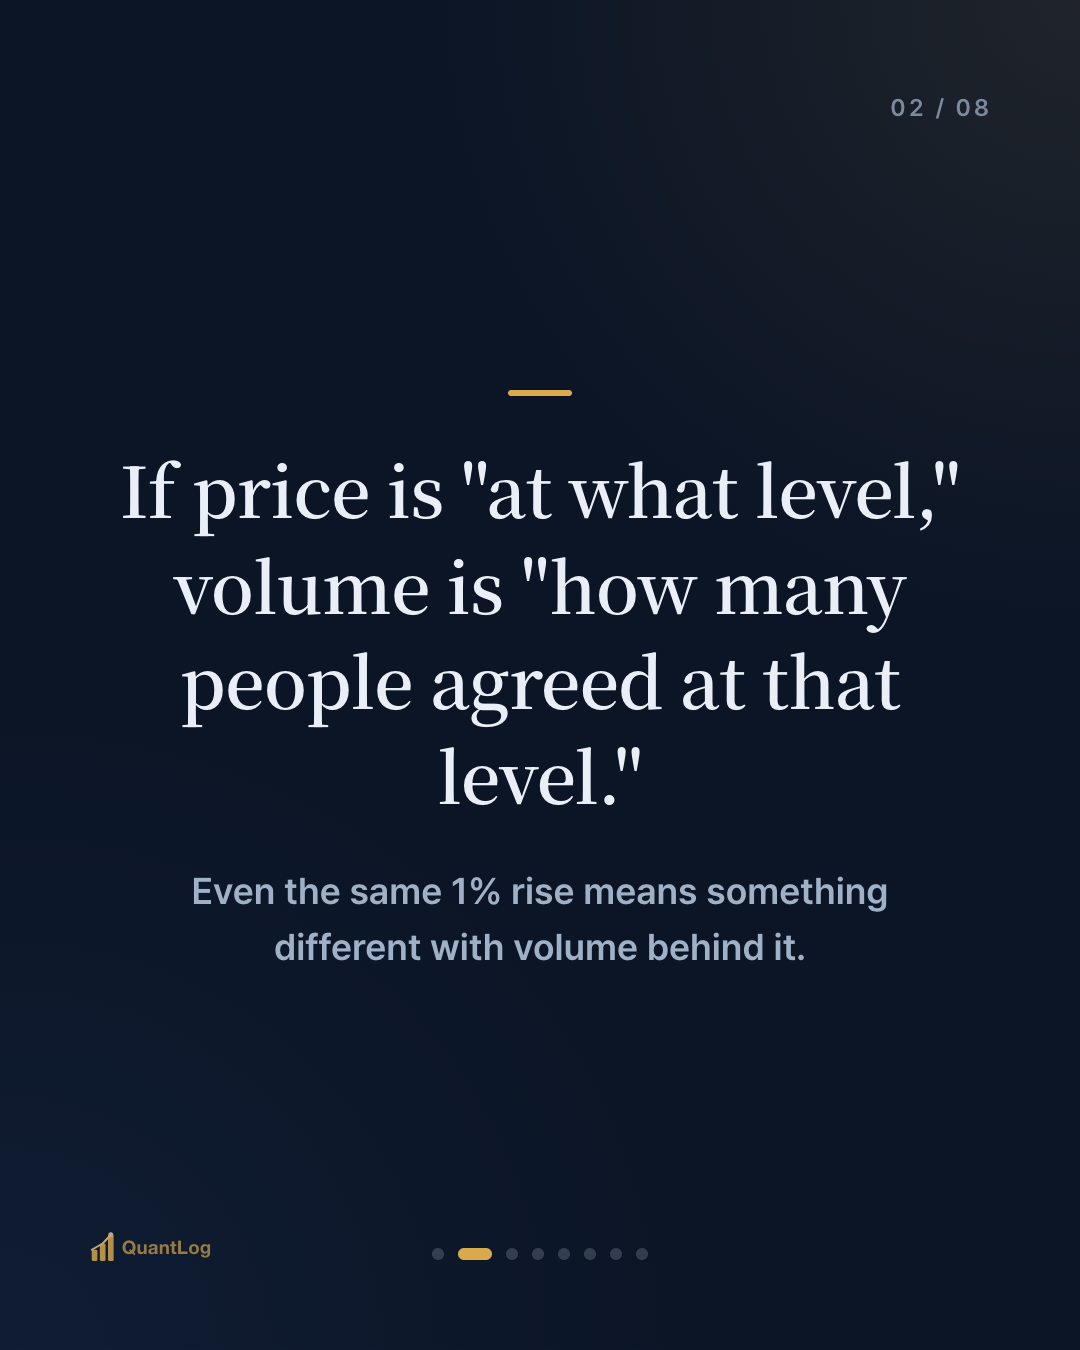
If price is "at what level," volume is "how many people agreed at that level." Even the same 1% rise means something different when it comes on triple the usual volume versus creeping up on almost no trading. The first is a move backed by many participants' agreement; the second is a move nudged by a few hands.
Why Read It as Price's Partner

Volume doesn't state a direction on its own. Instead, it's the partner that tells you how much weight is behind a price move. It's commonly read like this.
Confirming a trend. If price rises and volume rises with it, the advance is seen as backed by participation. Conversely, if price rises while volume shrinks, that's sometimes read as the advance losing its power.
The credibility of a breakout. When price breaks through a long-suppressed resistance line, heavy volume on the move makes the breakout more trustworthy. A breakout on no volume tends to get reversed — a long-standing observation.
The crux is that volume doesn't set price's direction; it's closer to a volume knob that adjusts the credibility of a price signal.
Common Misreadings

Use volume too simply and you'll misfire on three counts.
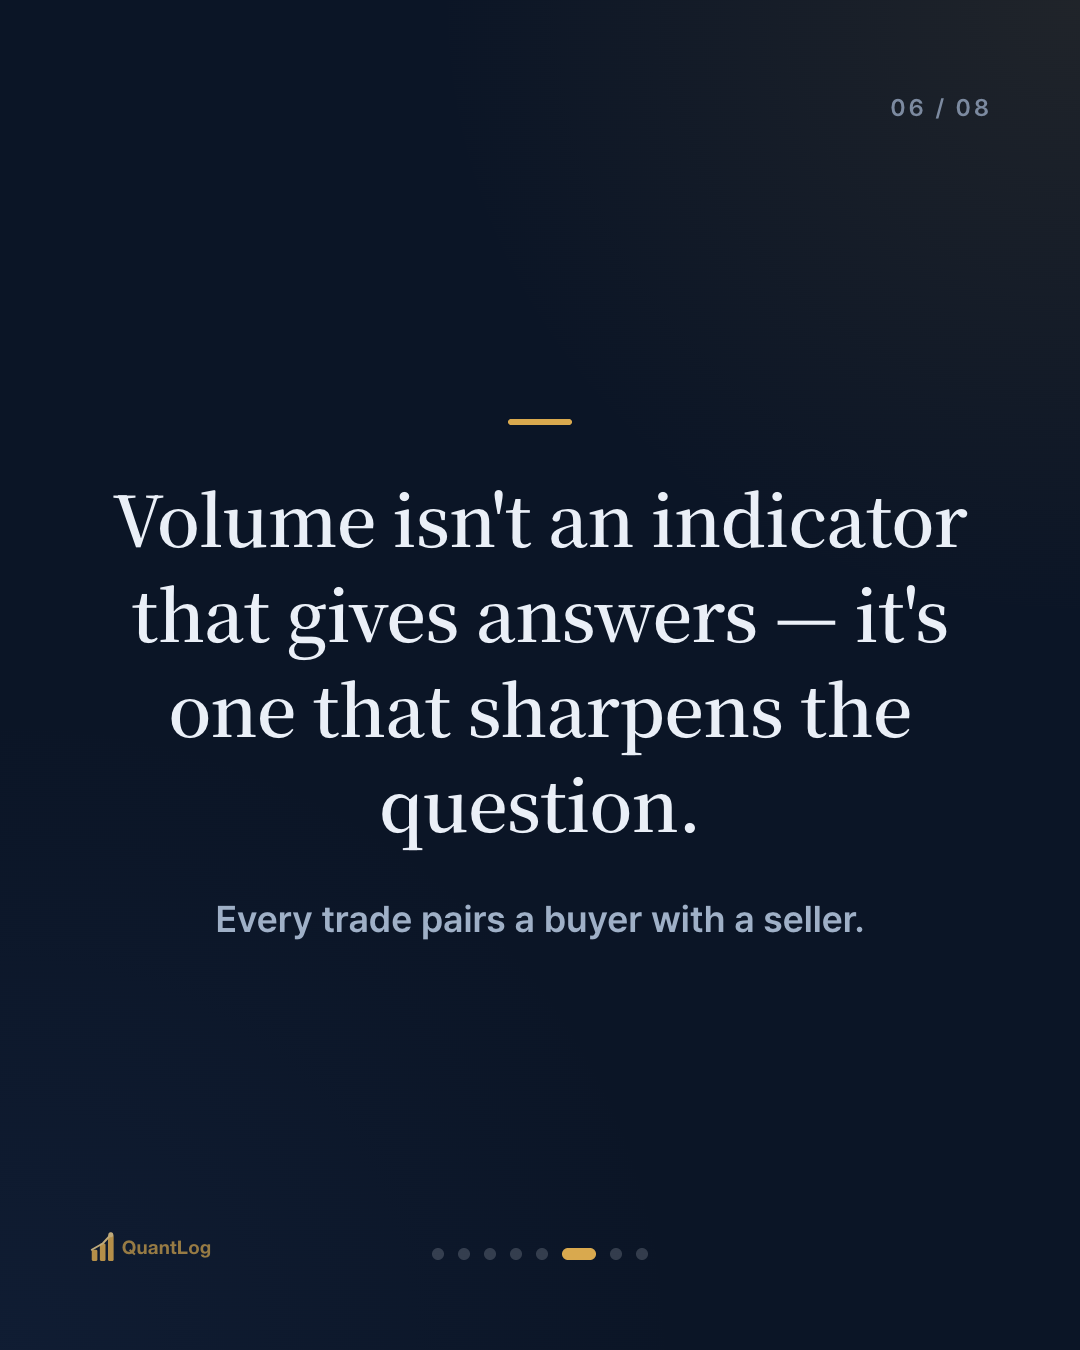
① High volume is always good. A volume spike can be strong buying or strong selling. Every trade pairs a buyer with a seller. Volume itself has no direction; it only gains meaning read alongside price. A spike at a high can actually be a change of hands — a signal that supply is being handed off.
② Comparing by absolute numbers. Whether one million shares is a lot depends on that stock's usual volume. So it's typically read as how many times the average volume it is. The benchmark differs completely from stock to stock, and between large caps and small caps.
③ Volume prophesies the future. Volume is a record of participation that already happened. It doesn't tell you what's ahead; it only confirms how much force was behind the move that just occurred.
Moments Where Volume Matters Most
Volume isn't equally important all the time. There are moments worth special attention.
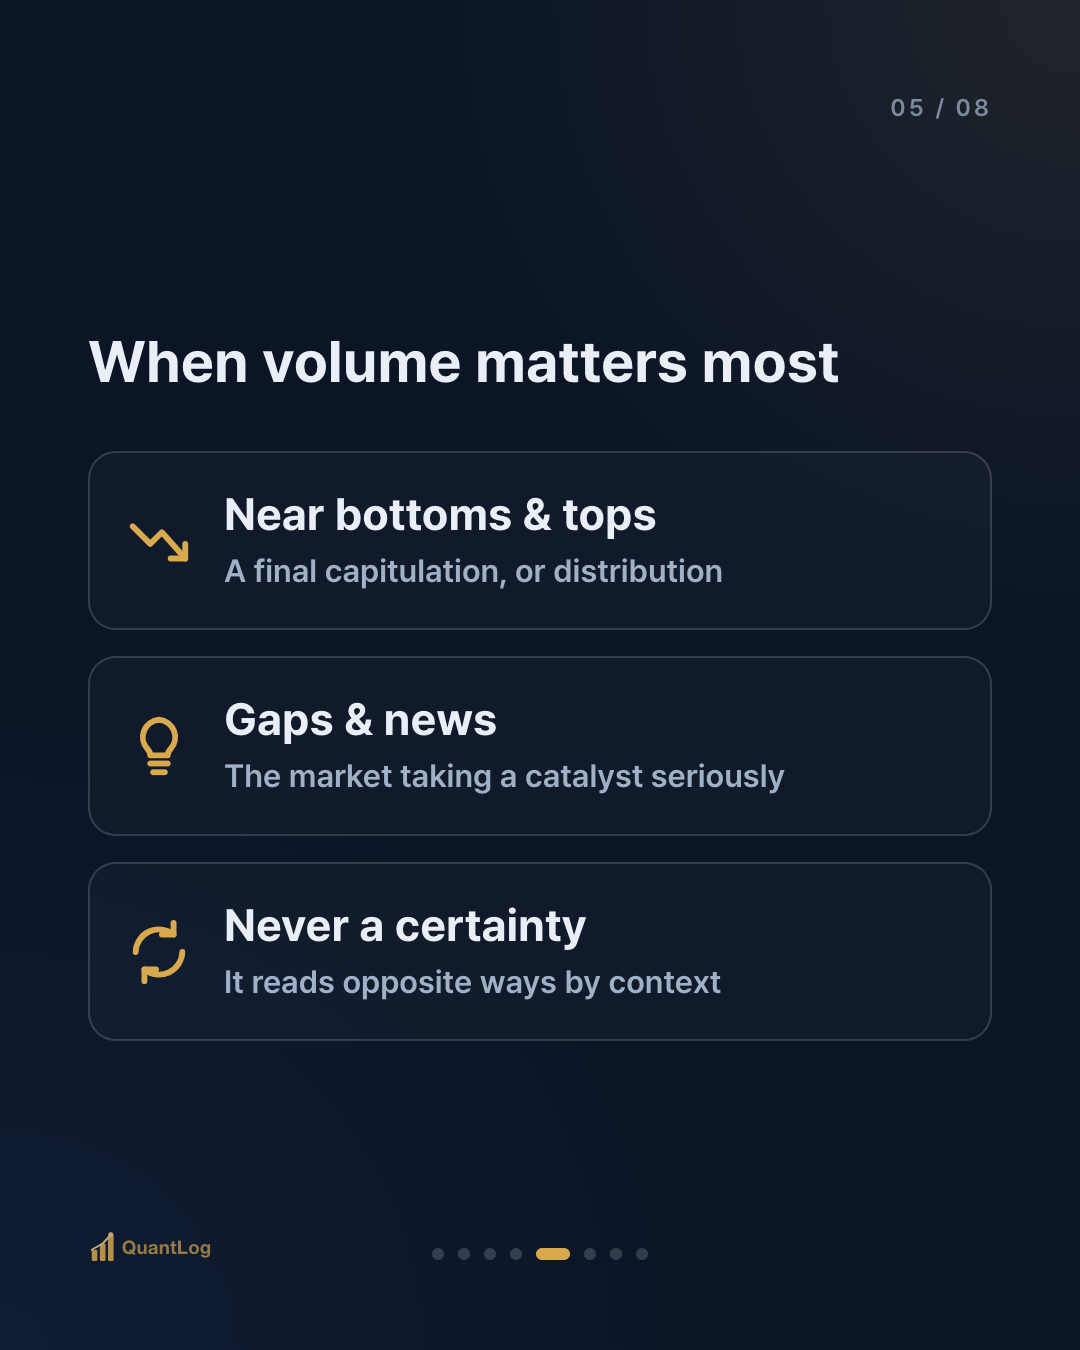
Near bottoms and tops. A big volume spike at the end of a long decline may be a final capitulation or a base being built. Conversely, a volume surge at the end of a long advance may be distribution — supply being handed off.
Gaps and news. When earnings or a disclosure gaps price and moves it, a simultaneous explosion of volume is read as the market taking that catalyst seriously.
But all of these readings are possibilities, not certainties. The same volume spike reads in opposite directions depending on context. Volume isn't an indicator that gives answers; it's one that sharpens the question.
To Sum Up
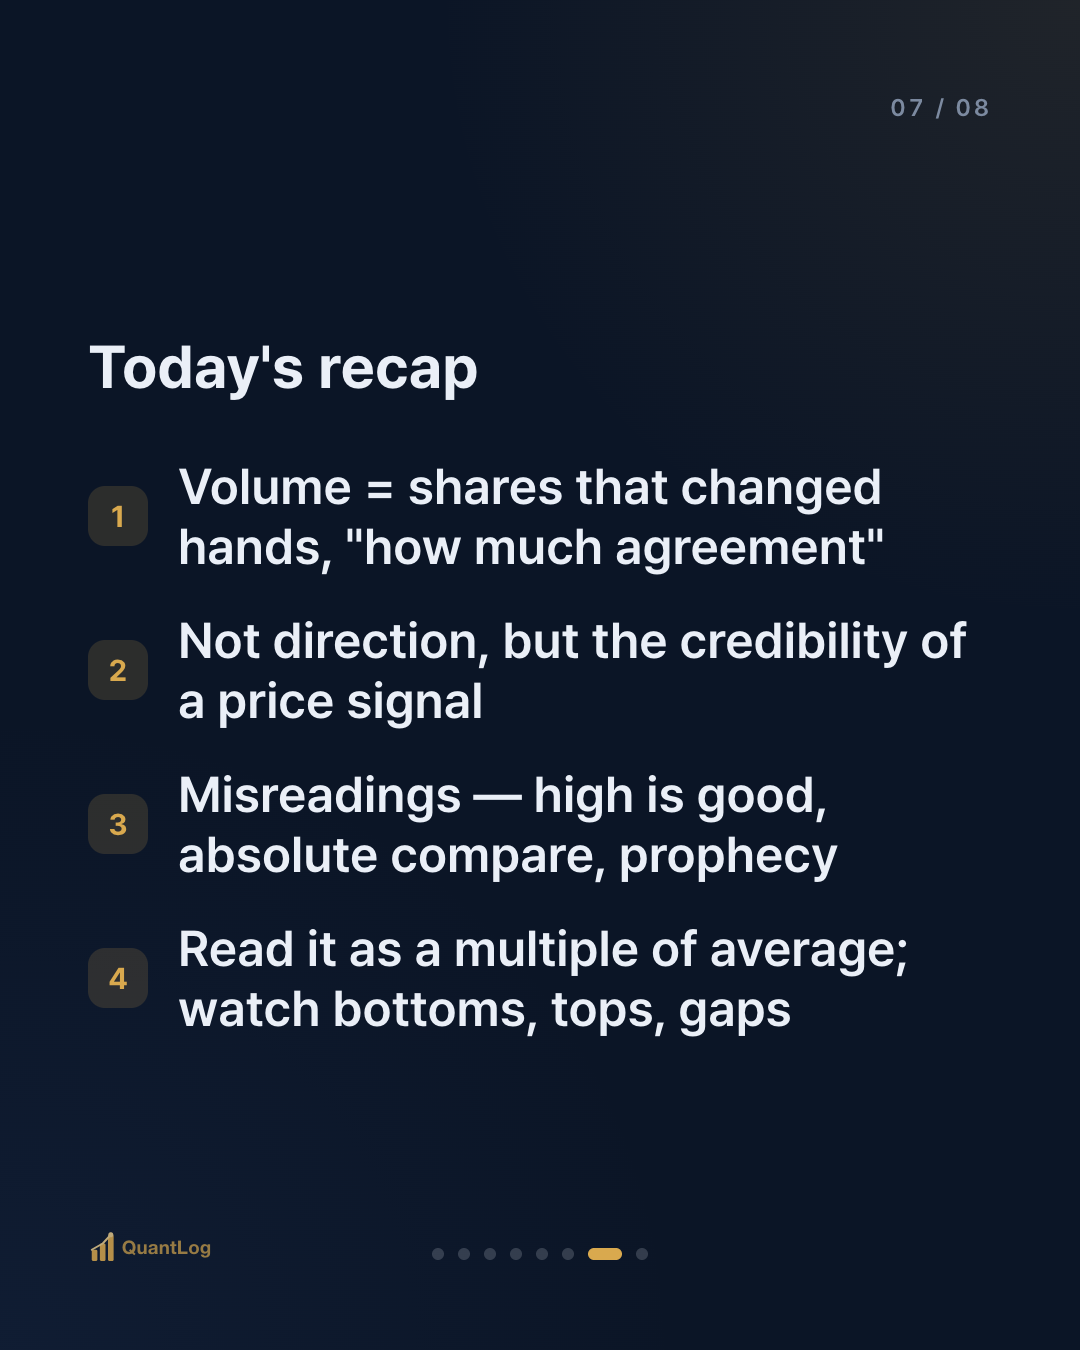
- Volume = the number of shares that actually changed hands over a period. If price is "at what level," volume is "how much agreement"
- Volume is not direction but the partner adjusting the credibility of a price signal — trend confirmation, breakout credibility
- Misreadings: high is always good, comparing by absolute numbers, prophesying the future. Every trade has a buyer and a seller
- Read it as a multiple of the average, and watch it especially near bottoms, tops, and gaps
Volume is the second axis standing behind price, the lead character. On its own it's sparing with words, but the moment you place it next to price, it quietly answers the question: "how much can I trust this move?"
References
- Murphy, J., *Technical Analysis of the Financial Markets* (1999) — the mutual confirmation of volume and price
- Granville, J., *New Key to Stock Market Profits* (1963) — the early concept of a volume-based indicator (OBV)
- That every fill pairs a buy and a sell side is a basic property of exchange matching

Disclaimer
This article is for informational purposes only and is not investment advice. It is not a recommendation to buy or sell any security. All investment decisions are your own responsibility.

Comments 0
Be the first to comment.