
Turn Bollinger Bands on and you get two lines wrapped around price, widening and narrowing as the chart moves. And almost everyone learns them the same way.
"Touch the upper band, it's expensive, sell. Touch the lower band, it's cheap, buy."
That reading runs directly against what the man who built the bands actually said. Once you see what Bollinger Bands really draw — and especially what happens when the band narrows — the reason becomes obvious.
What Bollinger Bands are, in one sentence
Bollinger Bands were created by John Bollinger in the early 1980s. They are three lines.
Middle line = a moving average over a set period (default 20)
Upper and lower lines = the middle line ± 2 standard deviations
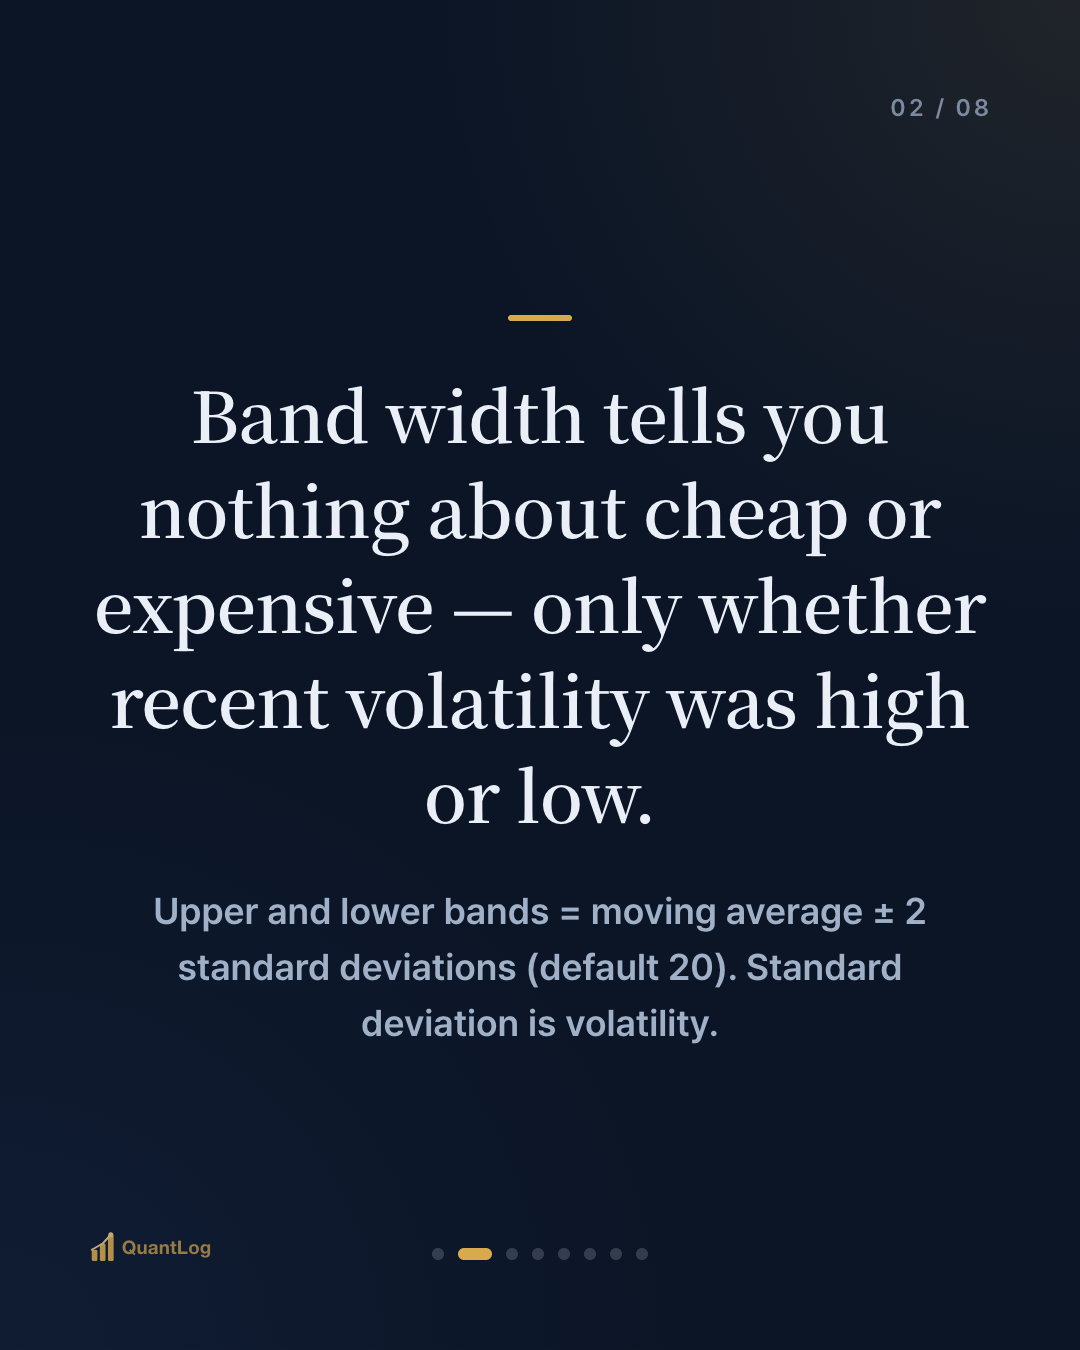
The default is a 20-period moving average with 2 standard deviations. The key is that the upper and lower bands are drawn from standard deviation. Standard deviation measures how scattered recent prices were around their average — in other words, volatility.
So the width of the bands tells you nothing about cheap or expensive. It tells you whether recent volatility was high or low. When volatility rises, the bands widen; when it settles down, the bands narrow.
When the band narrows — the "squeeze"
The most important signal in Bollinger Bands isn't a band touch — it's the width of the bands itself. Bollinger called the state where the bands pinch tightly together a squeeze.
A narrow band means recent volatility was very low. And market volatility has one persistent trait: it is neither calm forever nor violent forever — the two alternate. When a quiet stretch runs long, a large move tends to follow.
So a squeeze reads like this:
"Volatility has been suppressed for a while → a big move may be coming."
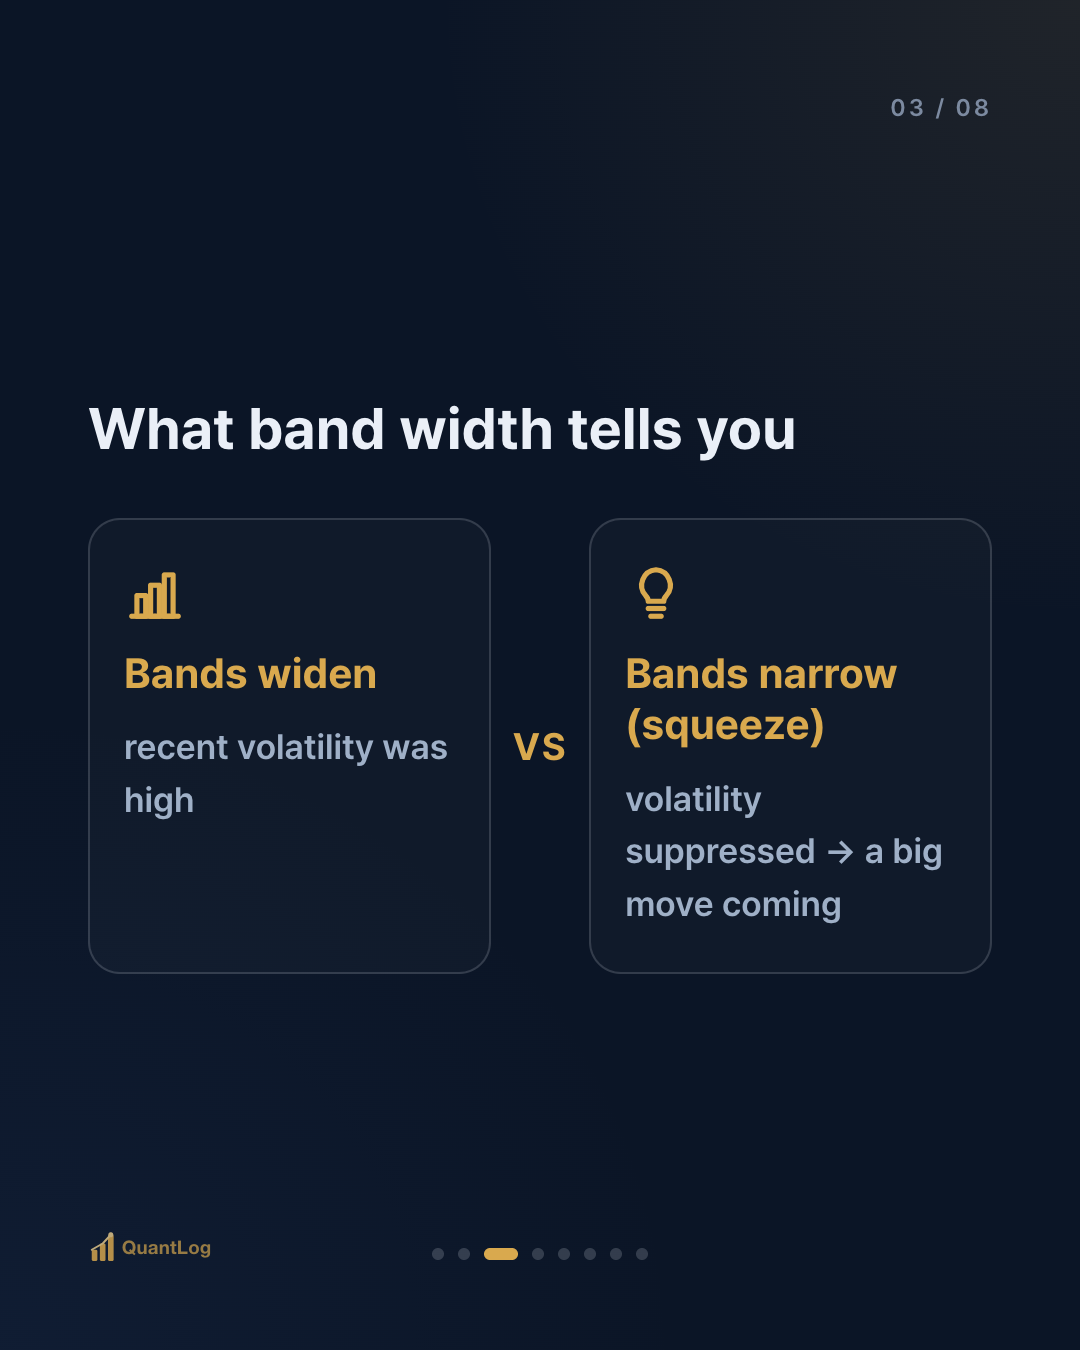
Here is the part you must not skip. A squeeze only tells you that a big move is coming — not which direction it will take. Whether a tight band breaks up or down is not something the band width alone can tell you. Reading a squeeze as "it's about to go up" is the most common mistake.
The common misconception — a band touch is not a trade signal
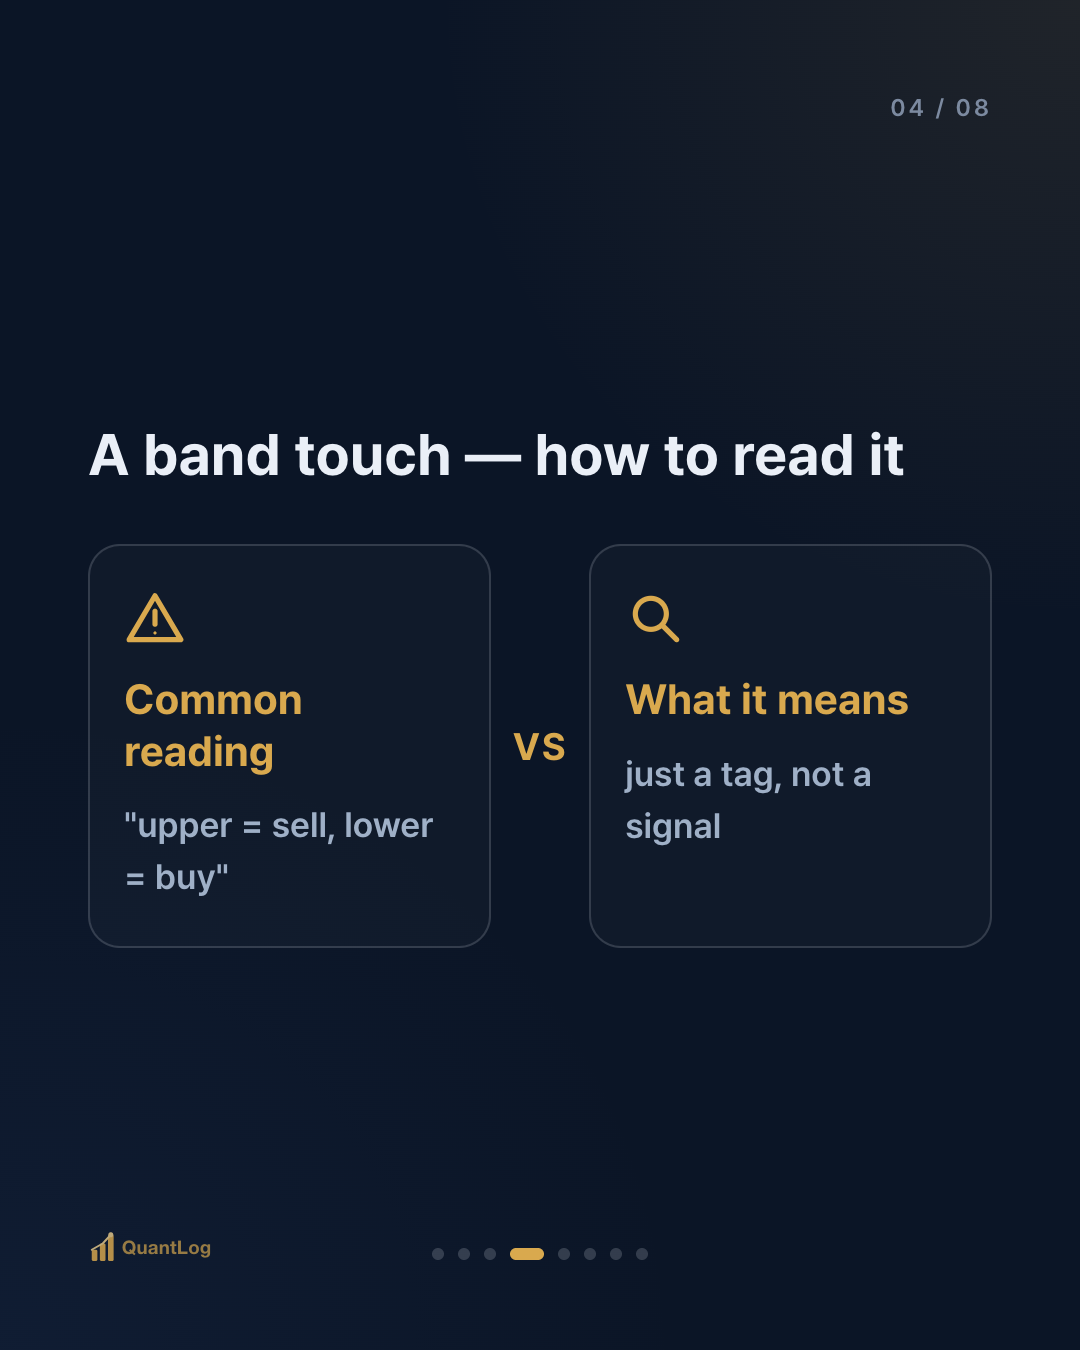
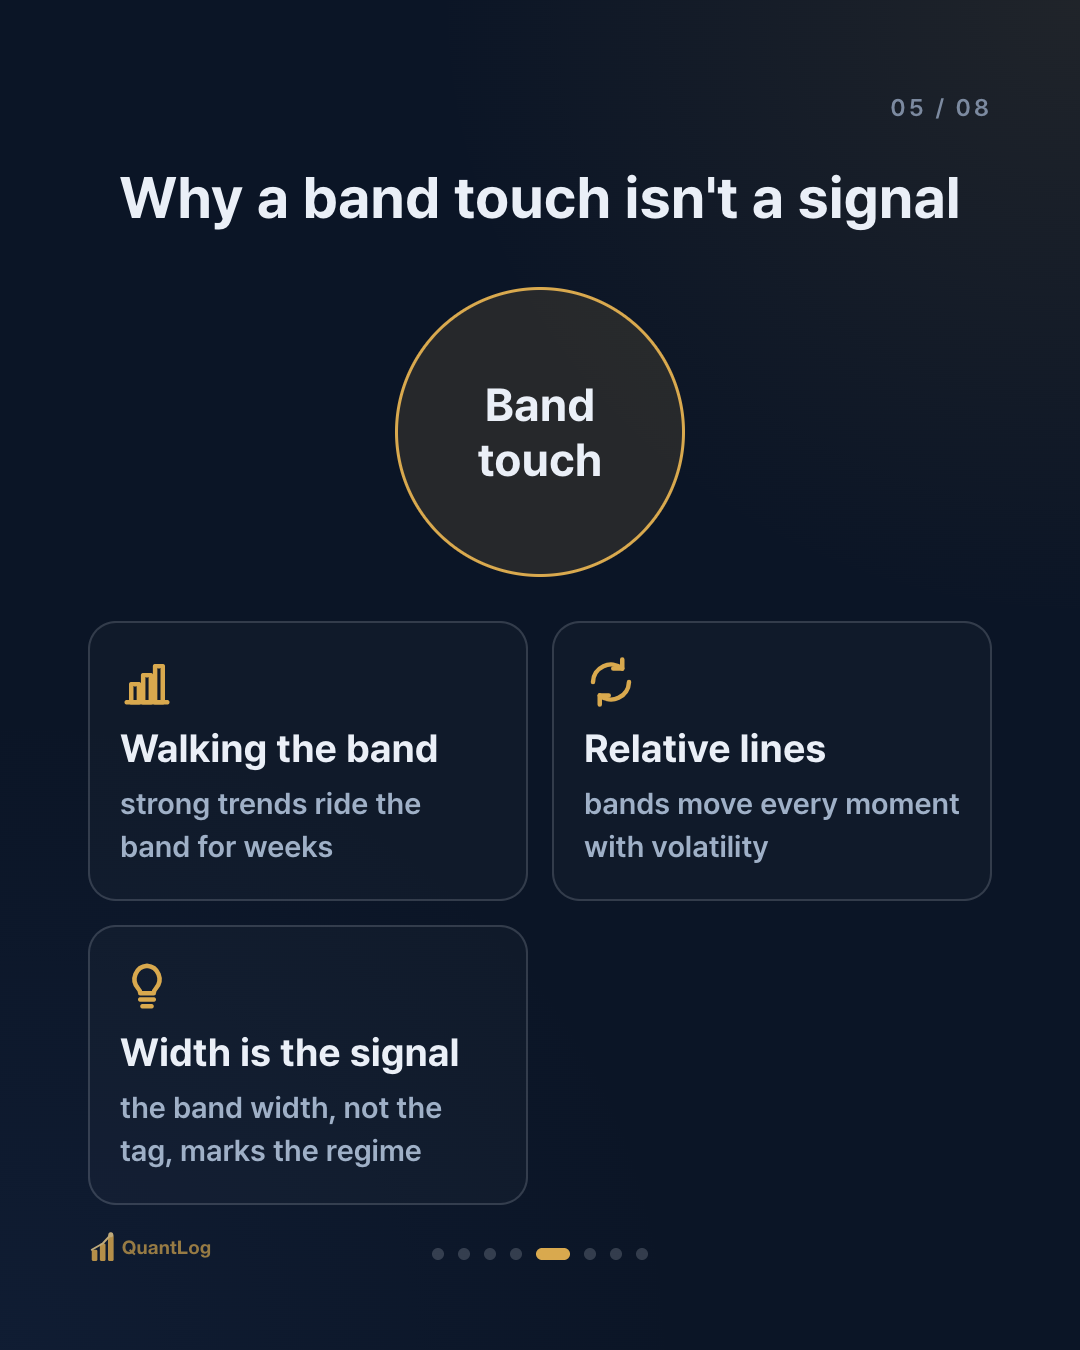
"Upper band touch = sell, lower band touch = buy" falls apart because it contradicts the rule of the person who built the bands. Bollinger nailed it down in his own book: a tag of the band is not a signal — it is just a tag.
① In a strong trend, price walks the band. When price rises hard, it glues itself to the upper band and climbs for weeks. This is called "walking the band." Read an upper-band touch as a sell and you miss the strongest advances — and can get badly hurt shorting into them. The lower band is the same: in a downtrend, price rides the lower band all the way down.
② The bands are relative. The upper and lower bands move every moment with volatility. Today's "upper band" and next week's "upper band" can be completely different prices. They are not a fixed cheap/expensive line.
So how do you use Bollinger Bands?
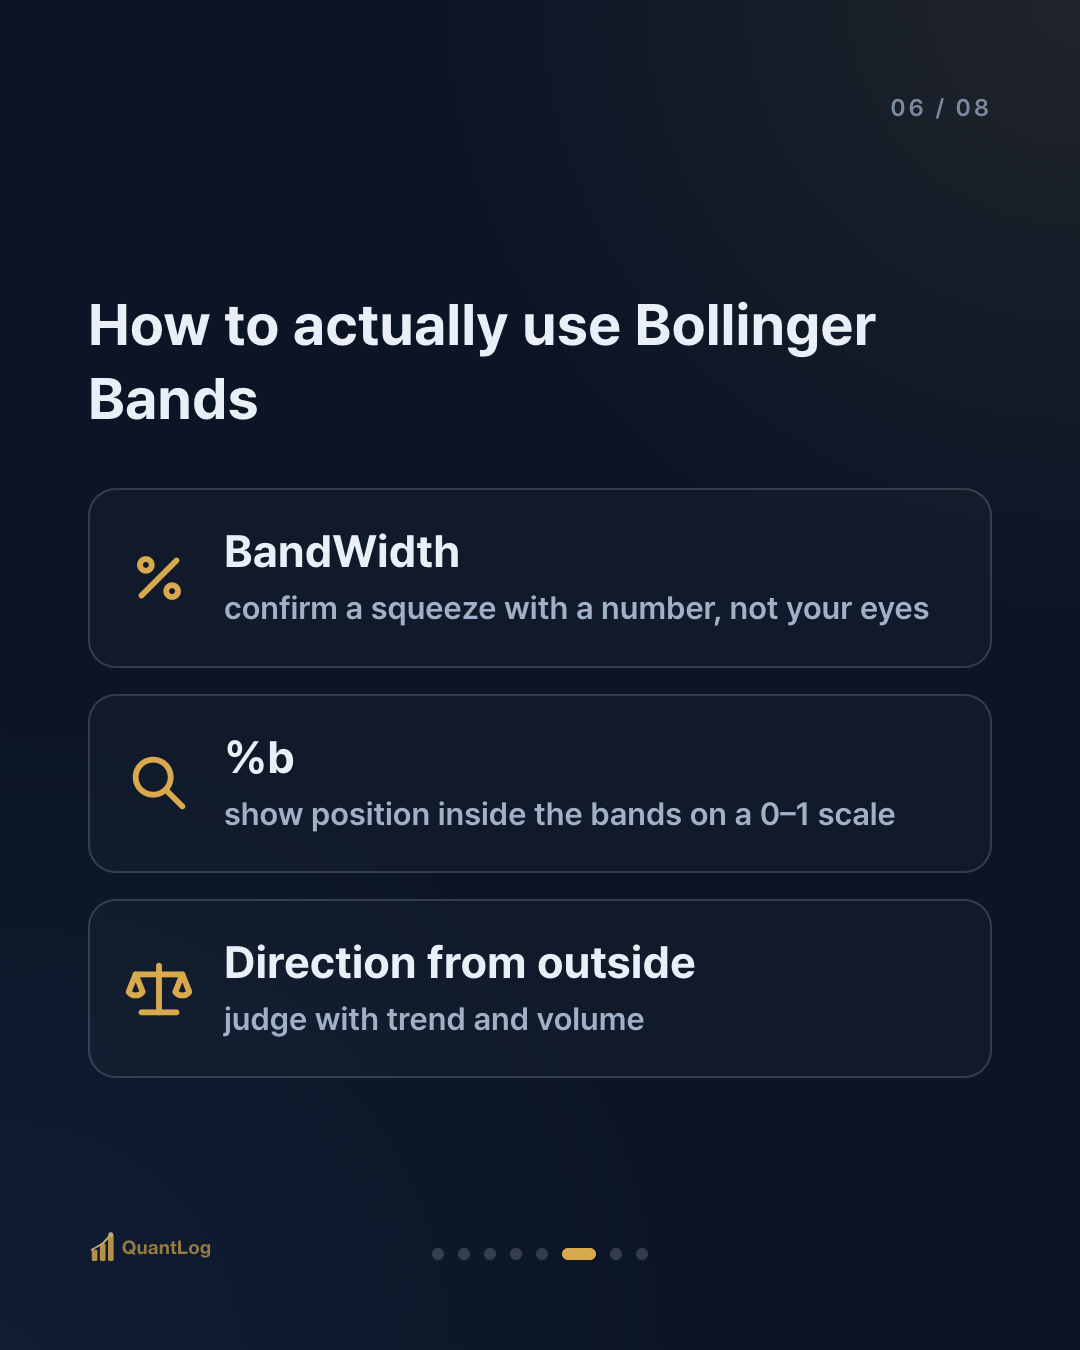
This isn't a case for throwing them out. The way the creator recommended is not to treat band touches as buttons, but to read the state the bands are drawing.
- Use BandWidth to read the volatility regime. Bollinger also proposed a BandWidth indicator that turns how tight the bands are into a number — so you can confirm a squeeze with a figure instead of your eyes.
- Use %b to read position inside the bands. %b shows where price sits inside the bands on a 0–1 scale. Instead of declaring a band touch decisive, you overlay it with other evidence.
- Bring direction from outside. A squeeze only tells you the size of the move, so which way it breaks has to come from other information — trend, volume. The moment you try to decide direction from Bollinger Bands alone, the misreading begins.
In short
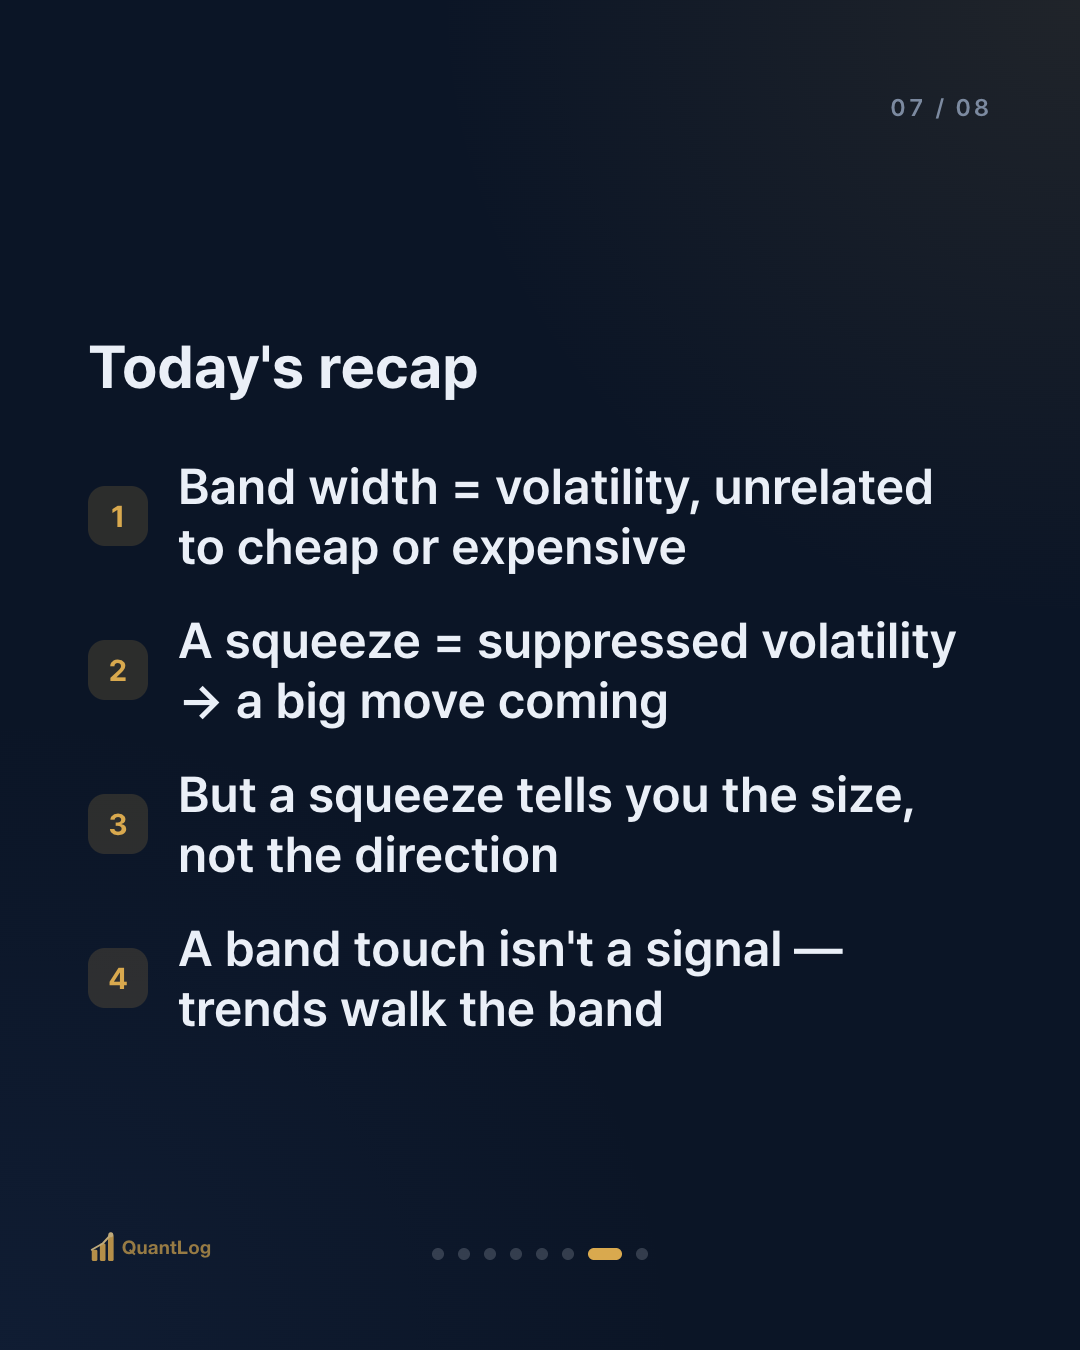
- Bollinger Bands = a moving average (default 20) with 2 standard deviations drawn above and below. Band width represents volatility
- A squeeze — narrow bands — means volatility was suppressed, and signals that a big move may be coming
- But a squeeze only tells you the size, not the direction
- A band touch is not a trade signal. In a strong trend, price walks the band
- If you use them, read the state with BandWidth and %b, and judge direction alongside other evidence
An indicator isn't an answer, it's a summary. Bollinger Bands summarize "what regime is volatility in right now" — they never say "buy now."
References
- John Bollinger, *Bollinger on Bollinger Bands* (2001) — the original definition (20-period, 2 standard deviations), the squeeze, BandWidth and %b, and the rule that "a band tag is not a signal"
- Bollinger's base rules — the bands are relative, and a squeeze forecasts a volatility expansion, not a direction

Disclaimer
This article is for informational purposes only and is not investment advice. It is not a recommendation to buy or sell any security. All investment decisions are your own responsibility.

Comments 0
Be the first to comment.